
- PRICING
- LIVE QUOTES
- LEARN
- HELP


EN
SaizeriyaLtd (TSE:7581) Looks Fairly Valued Following Its Dividend Guidance Lift
Saizeriya Ltd (TSE:7581) has drawn fresh attention after its board met on July 15, 2026 to review dividend policy, followed by revised guidance lifting the planned fiscal 2026 dividend to ¥35 per share.
See our latest analysis for SaizeriyaLtd.
The revised dividend guidance has arrived alongside sharp share price momentum for Saizeriya Ltd, with a 1 month share price return of 47.57% and a 1 year total shareholder return of 53.28%. This suggests investors are reassessing both its income profile and long term prospects.
If this dividend move has you rethinking your watchlist, it could be a good moment to broaden your search and see what stands out in our 11 top founder-led companies
Bulls view Saizeriya Ltd’s higher dividend and share price strength as indications that the stock may still have room to run, while bears highlight what they see as stretched expectations. Which side will the valuation case support next?
Price-to-Earnings of 30.9x: Is It Justified for Saizeriya Ltd?
On current numbers, Saizeriya Ltd trades on a P/E of 30.9x, and the stock is described as good value compared with its peer average of 81.9x, yet expensive versus both the broader hospitality industry and an estimated fair P/E level.
The P/E ratio links Saizeriya Ltd's share price to its earnings, giving a snapshot of how much investors are currently paying for each unit of profit. For a restaurant operator with established operations across Japan and parts of Asia, this is a straightforward way for you to compare its pricing to other listed hospitality companies.
Relative to direct peers on an 81.9x average P/E, Saizeriya Ltd's 30.9x suggests the stock is priced lower than many companies investors are using as comparison. This could indicate the market is not paying a similar premium for its earnings. At the same time, the company is described as expensive against the wider JP hospitality industry average P/E of 20.9x. It is also above an estimated fair P/E of 27.5x, which points to a level that some investors may see as leaving room for the multiple to move closer to that fair ratio over time.
Explore the SWS fair ratio for SaizeriyaLtd
Result: Price-to-Earnings of 30.9x (ABOUT RIGHT)
However, Saizeriya Ltd’s recent 1 year total return of 53.28% and current P/E of 30.9x could unwind quickly if earnings or dividend expectations are disappointed.
Find out about the key risks to this SaizeriyaLtd narrative.
Another View: Saizeriya Ltd Through a Cash Flow Lens
While the 30.9x P/E suggests Saizeriya Ltd is a little ahead of its 27.5x fair ratio, the SWS DCF model points in the opposite direction. With the stock at ¥7,600 against an estimated future cash flow value of ¥11,832.49, this framework presents Saizeriya Ltd as trading at a discount and raises the question of which signal you trust more.
Look into how the SWS DCF model arrives at its fair value.
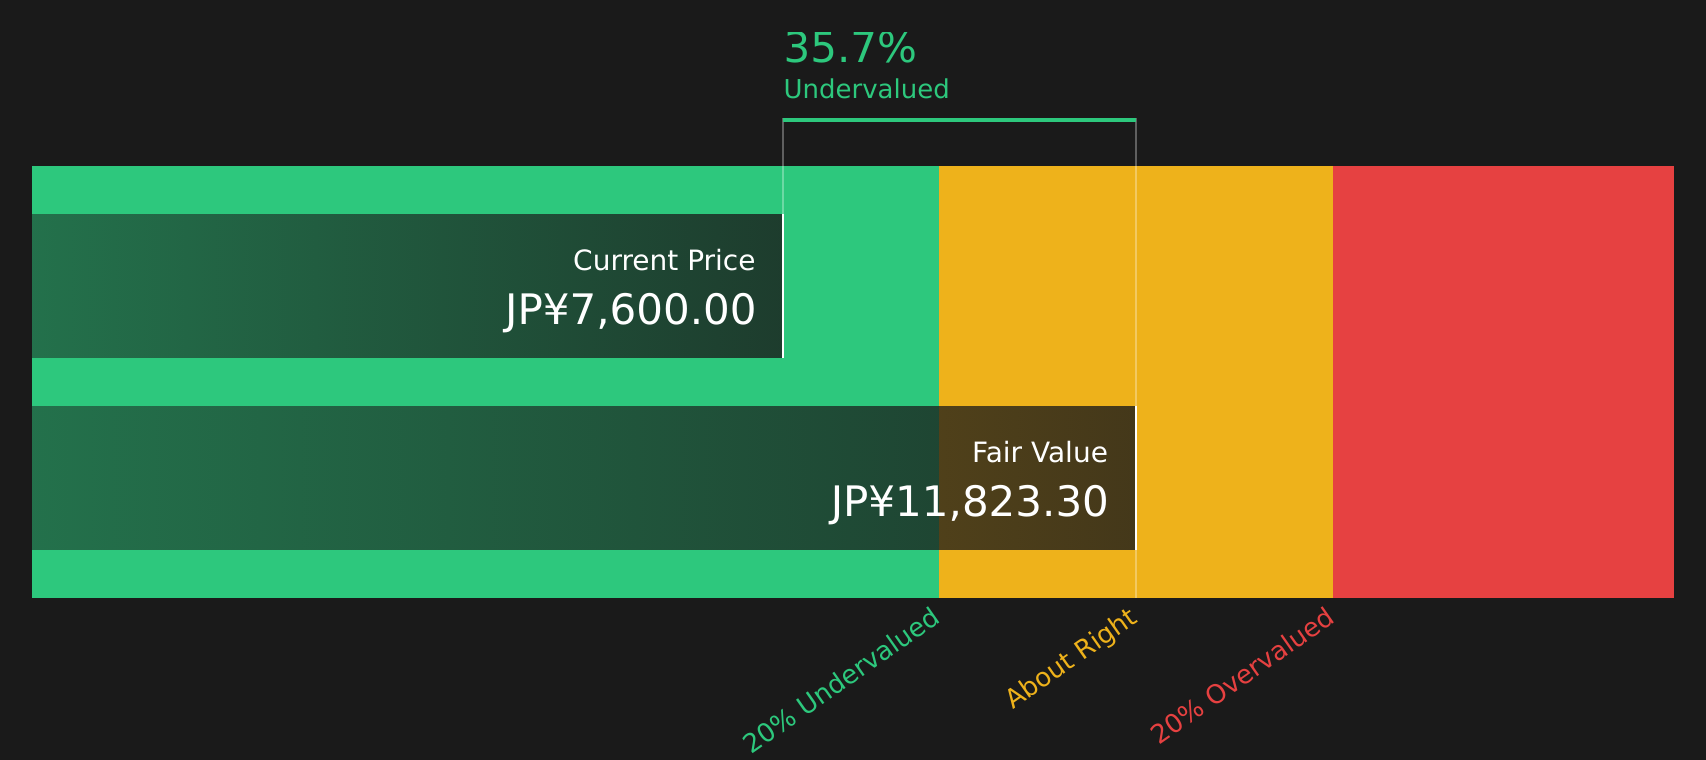
Simply Wall St performs a discounted cash flow (DCF) on every stock in the world every day (check out SaizeriyaLtd for example). We show the entire calculation in full. You can track the result in your watchlist or portfolio and be alerted when this changes, or use our stock screener to discover 18 high quality undervalued stocks. If you save a screener we even alert you when new companies match - so you never miss a potential opportunity.
Next Steps
Given the mixed signals around Saizeriya Ltd, it makes sense to look at the full picture yourself and move promptly while the data is fresh. To quickly see how the positives and negatives stack up side by side, take a look at the 3 key rewards and 1 important warning sign
Looking for more investment ideas beyond Saizeriya Ltd?
If Saizeriya Ltd has sharpened your focus, do not stop here. Use the Simply Wall Street Screener to spot other opportunities that could suit your portfolio.
- Target potential upside by scanning companies that look mispriced on quality and valuation using our 18 high quality undervalued stocks.
- Strengthen your income stream by reviewing stocks that feature resilient, higher yielding payouts in the 46 dividend fortresses.
- Dial down risk by focusing on companies with healthier balance sheets and fundamentals with the solid balance sheet and fundamentals stocks screener (37 results).
This article by Simply Wall St is general in nature. We provide commentary based on historical data and analyst forecasts only using an unbiased methodology and our articles are not intended to be financial advice. It does not constitute a recommendation to buy or sell any stock, and does not take account of your objectives, or your financial situation. We aim to bring you long-term focused analysis driven by fundamental data. Note that our analysis may not factor in the latest price-sensitive company announcements or qualitative material. Simply Wall St has no position in any stocks mentioned.
Have feedback on this article? Concerned about the content? Get in touch with us directly. Alternatively, email editorial-team@simplywallst.com