- PRICING
- LIVE QUOTES
- LEARN
- HELP


EN
Kerui: The land supply scale in the 50 key cities increased by more than 30% in June, and the average premium rate climbed to 23.06%
The Zhitong Finance App learned that Kerui Real Estate published an article stating that in June, both sides of land supply and demand rebounded simultaneously in the 50 key cities, and the supply scale increased by more than 30% month-on-month, and the overall scale was clearly restored month-on-month compared to previous months. In terms of land supply structure, the proportion of high-quality land plots in core cities has increased, and the “demand based on demand and accurate supply” strategy continues to show results.
Judging from the three dimensions of total price, unit price, and premium rate, the popularity of the land market in June was highly concentrated on high-quality residential land in first-tier and core second-tier cities, showing the characteristics of the trinity of “volume and price heat.”
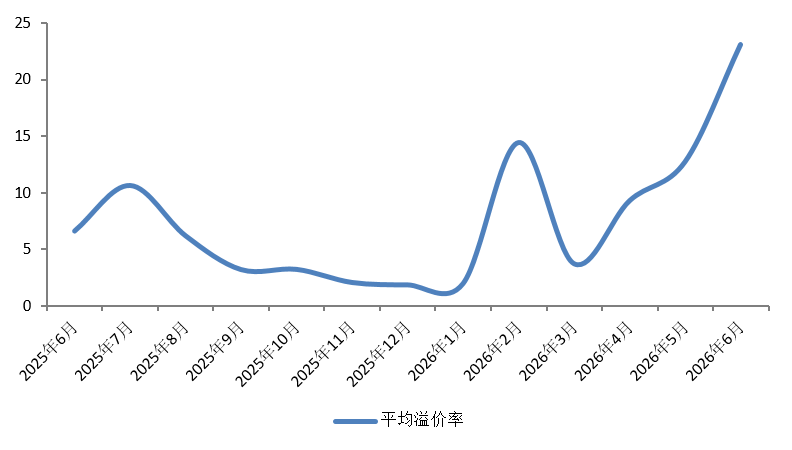
The average premium rate climbed to a high level of 23.06% in June, and many high-quality residential land in core cities such as Shenzhen and Hangzhou achieved ultra-high premium transactions. Although the auction rate rose slightly to 4.38%, the overall level is still low, and the confidence of housing enterprises to acquire land continues to recover.
The volume of transactions in first-tier cities all increased month-on-month. Looking at changes in transaction value, the first-tier cities rose 337% year on year, the second tier fell 62% year on year, and the third and fourth tier fell 44% year on year.
supply and demand
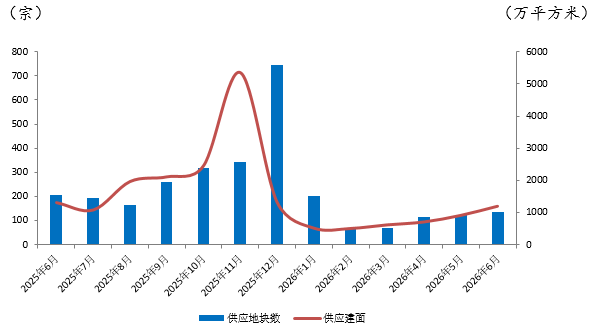
In terms of land supply, in June 2026, the scale of land supply in the 50 key cities continued the steady upward trend since March of this year. A total of 137 plots were recorded in a single month, and the total land supply area reached 11.9452 million square meters, a year-on-year decrease of 8.6% and a month-on-month increase of 31.33%. Among them:
Among the first-tier cities, Beijing, Shanghai, Guangzhou, and Shenzhen all have core residential land listed. Among them, the supply floor area in Beijing reached 438,300 square meters, while the supply floor area of Guangzhou and Shanghai was about 120,000 square meters and 119,400 square meters respectively. Shenzhen had the lowest supply floor area, about 65,800 square meters.
Among second-tier cities, cities such as Chongqing, Nanjing, Wuhan, Xi'an, Chengdu, and Fuzhou lead the supply scale, with a land supply area of over 700,000 square meters. Among them, Chongqing was the only city with a land supply area of more than 1 million square meters in June, and core second-tier cities such as Hangzhou, Jinan, and Xiamen also all have high-quality residential land in the market.
Among the third- and fourth-tier cities, cities such as Wenzhou, Xuzhou, Yangzhou, and Foshan had the highest land supply scale, with 642,700 square meters, 556,700 square meters, 417,400 square meters, and 3871,000 square meters respectively. Other cities all supplied less than 200,000 square meters or had no land sales.
Overall, the land supply side showed two prominent characteristics in June: first, in terms of scale, supply increased by more than 30%, continuing the repair trend since the second quarter, but there was still a slight year-on-year decline, and the overall land supply was in a moderate recovery channel; second, structurally, the focus of land supply was clearly skewed towards core cities. The supply volume of second-tier cities such as Chongqing, Nanjing, Wuhan, and Chengdu occupied the absolute main force. Among the third- and fourth-tier cities, only a few cities, such as Wenzhou and Xuzhou, remained on a certain scale, and most cities still had a low land supply volume. The overall supply structure is dominated by high-quality land plots in core cities, and the strategy of “customized supply based on demand and accurate supply” has been continuously implemented.
Figure 1 Monthly supply of residential land in 50 key cities from June 2025 to June 2026
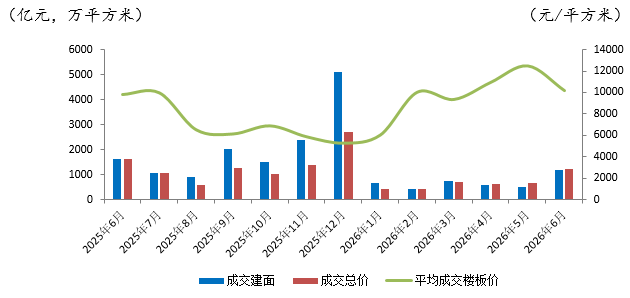
In terms of transactions, in June 2026, the volume of land transactions in the 50 key cities rebounded markedly, with a total construction area of about 11.8383 million square meters, down 27.63% year on year and up 129.59% month on month; total transaction price was about 120,407 billion yuan, down 24.95% year on year and 87.30% month on month; average transaction price was about 10,171 yuan/square meter, up 3.71% year on year and 18.42% month on month. The month-on-month decline in average transaction prices was mainly affected by a sharp increase in the share of transactions in second-tier cities — the six second-tier cities of Chongqing, Hangzhou, Chengdu, Nanjing, Wuhan, and Xi'an all had a construction area of over 800,000 square meters in the same month, accounting for 50% of the total transactions.
Figure 2 Monthly residential land transactions in 50 key cities from June 2025 to June 2026
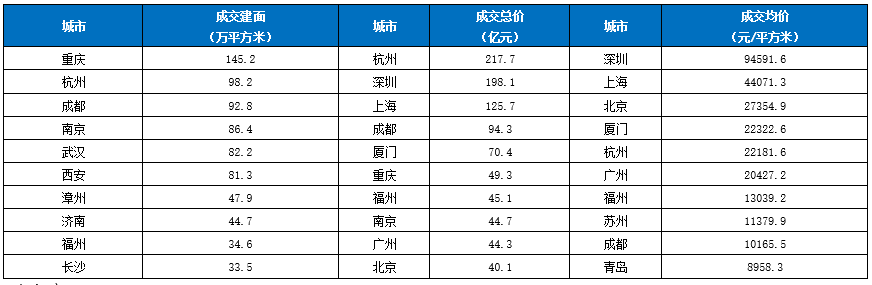
Judging from the city's performance, Chongqing is far ahead with 1.452 million square meters of construction, followed by Hangzhou, Chengdu, Nanjing, Wuhan, and Xi'an, all with a total transaction area of over 800,000 square meters; total transaction prices in Hangzhou, Shenzhen, and Shanghai all exceeded 10 billion yuan, reaching 21.77 billion yuan, 19.81 billion yuan, and 12.57 billion yuan respectively, becoming the core force driving the total price scale. In terms of average transaction price, Shenzhen, Shanghai, Beijing, Xiamen, Hangzhou, and Guangzhou ranked in the top six, all exceeding 20,000 yuan/square meter. The value of high-quality land in core cities was prominent; among them, the average transaction price in Shenzhen reached 945,91.6 yuan/square meter, leading the fault line.
Table 1 Top 10 residential land transactions involving construction surface, total transaction price, and average transaction price in the 50 key cities in June 2026
heat
The premium rate continues to rise, and Shenzhen has taken the top three premium rates
In June 2026, the average land premium rate in the 50 cities continued to rise. Many high-quality residential land plots in core cities were sold at high premiums, and market confidence in land acquisition continued to recover. Among them, many premium land lots were sold at premium in core cities such as Shenzhen and Hangzhou. The premium rate for the T204-0153 plot in Nanshan District of Shenzhen reached 150.74%, the premium rate for the T201-0233 plot reached 114.29%, the premium rate for the A002-0113 plot reached 99.05%, and the premium rate for the Yongyonghe unit plot in Hangzhou reached 79.03%. Competition for high-quality land in core cities is fierce, and market popularity has rebounded markedly. Overall, high-premium land plots are concentrated in first-tier and core second-tier cities, and housing enterprises are strongly willing to compete for high-quality assets with strong certainty.
Figure 3 Monthly trend of average premium rates for residential land transactions in 50 key cities from June 2025 to June 2026 (%)
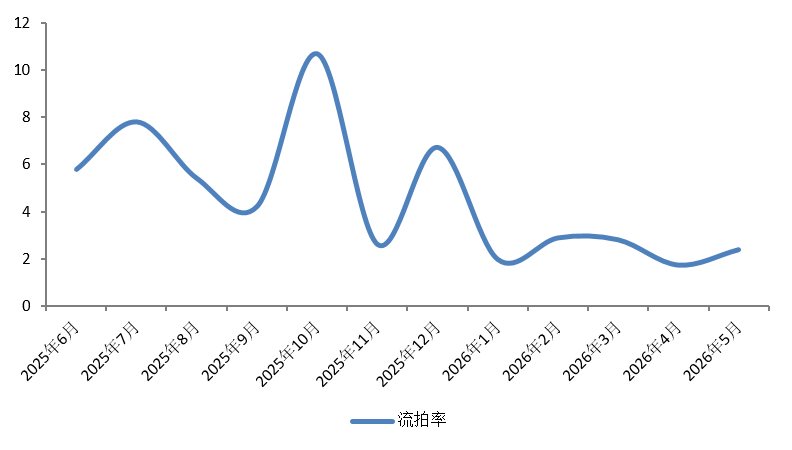
The land auction rate in June was 4.38%. Although it was a monthly high since 2026, it is still at a low level since the deep adjustment of real estate, indicating that the overall pressure on the land market to be eliminated is low, and the confidence of housing enterprises to acquire land is steadily recovering. Streamlined plots are mainly distributed in third- and fourth-tier cities. Almost all high-quality plots in core cities have been successfully sold, and the pattern of market differentiation continues.
Figure 4 Monthly trend of residential land flow rate in 50 key cities from June 2025 to June 2026