
- PRICING
- LIVE QUOTES
- LEARN
- HELP


EN
Citigroup (C) Stock Could Trade Below Fair Value After 206% Run
Citigroup stock has more than doubled over the past three years, yet current valuation checks suggest the market may still be pricing it below an intrinsic value estimate based on the Excess Returns model. That leaves investors weighing a strong share price recovery against indicators that both the intrinsic value and earnings multiples point to potential undervaluation.
- Citigroup has delivered a 206.5% return over three years, which puts extra focus on whether the recent share price now fully reflects its underlying earning power.
- Progress on Citi's multi year transformation and its push into areas such as tokenized payments and housing finance can support expectations for future cash generation. At the same time, planned job cuts and higher severance and investment spending may pressure near term profitability and affect what investors are willing to pay.
- On Simply Wall St's checks, Citigroup screens as undervalued on multiples and its Excess Returns intrinsic value estimate. However, with a mixed score of 3 out of 6, the broader picture is more balanced than a clear cut bargain.
The issue now is whether Citigroup's recent rerating has already captured most of that apparent discount or if there is still room for further upside before the stock trades in line with its intrinsic value estimates.
Does Citigroup Look Undervalued on Excess Returns?
The Excess Returns model looks at how much value Citigroup creates over and above the return investors require on its equity. For a large bank like Citigroup, that means focusing on return on equity and how sustainably it can compound its book value per share.
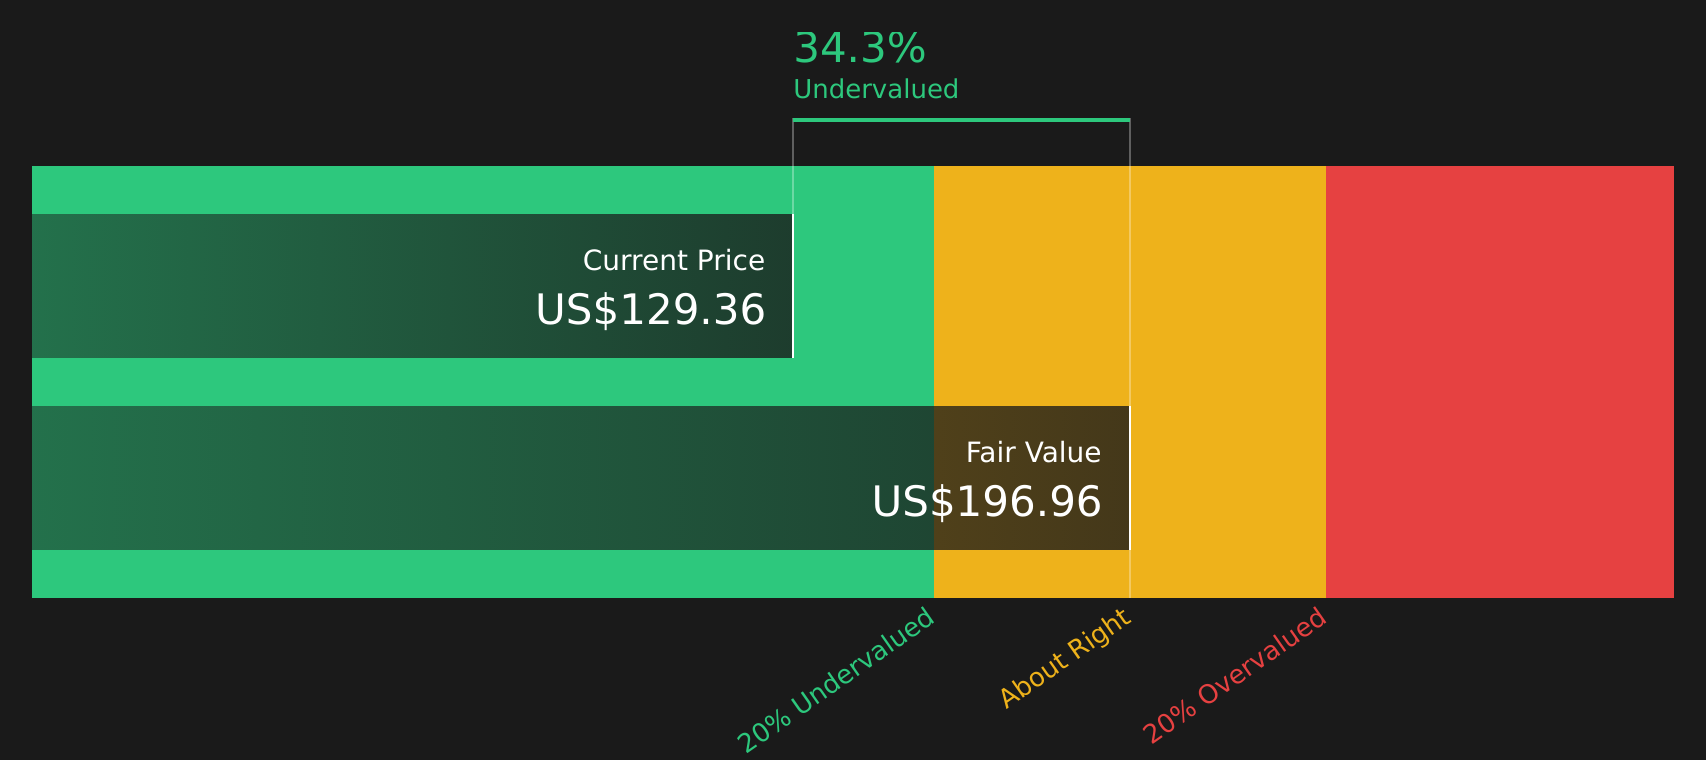
On the current inputs, Citigroup is assumed to earn stable EPS of $13.20 per share on a stable book value base of $127.65 per share, implying an average return on equity of 10.34%. With a cost of equity of $10.15 per share, the model estimates an excess return of $3.05 per share and an intrinsic value of about $196.73 per share. Compared with the recent share price, that framework suggests the stock is trading at a 33.1% discount to this Excess Returns estimate, indicating the market may not be fully crediting those projected economics.
News that Citi flags potential for more severance this year and higher investment spending helps explain why investors may still be cautious even if the Excess Returns model indicates potential upside.
Overall, the Excess Returns analysis indicates Citigroup stock currently appears undervalued relative to its modeled intrinsic value.
Our Excess Returns analysis suggests Citigroup is undervalued by 33.1%. Track this in your watchlist or portfolio, or discover 49 more high quality undervalued stocks.
Is Citigroup a Bargain on Earnings?
P/E is usually a straightforward way to compare large, established banks like Citigroup, because earnings already reflect credit costs, funding and fee income in one number.
Citigroup trades on a P/E of 13.4x, very close to both its peer average of 13.3x and slightly above the broader banks industry average of 12.3x. On those simple comparisons, the stock appears roughly in line with where many other banks trade today.
However, a more tailored fair P/E of 16.0x, which factors in Citigroup's specific growth, profitability profile, size and risk, sits meaningfully above the current 13.4x. That gap indicates the market is applying a discount to what the model implies investors might typically pay for these earnings, even as Citigroup undertakes its multi year transformation and invests in areas such as tokenized payments.
Overall, Citigroup stock appears undervalued on a P/E basis, with its earnings multiple below the level suggested by the fair ratio model.

See what the numbers say about this price — find out in our valuation breakdown.
The Citigroup Narrative: What Would Justify Today's Price?
Simply Wall St Narratives for Citigroup pick up where this valuation puzzle leaves off. They spell out which assumptions about Citigroup's future growth, margins and earnings would need to hold for the stock to be worth materially more or less than today's price, and set those expectations out on the Community page. Each one treats its view of fair value as a thesis about how Citigroup's business might evolve over time, so you can see how that story holds up as new information appears.
Citi's community views are split between a digital asset and capital efficiency bull story and a caution that earnings quality and valuation expectations may be running ahead of themselves.
Bull case: 43% undervalued
"digital assets are the next evolution in the broader digitization of payments, financing and liquidity"…
Read the full Bull Case to see why Citigroup could be undervalued
Bear case: roughly fairly valued
Heavy macroeconomic influence and high expenses from transformation investments could pressure Citigroup's revenues, margins, and net earnings amid regulatory and credit risk challenges…
Read the full Bear Case to see why Citigroup could be overvalued
Do you think there's more to the story for Citigroup? Head over to our Community to see what others are saying!
The Bottom Line
For Citigroup, both the Excess Returns intrinsic value estimate and the P/E workup point in the same direction, with the stock screening as undervalued rather than stretched. The key question is whether management can turn the current transformation, higher severance and investment spend into sustained returns on equity that align with those intrinsic value assumptions. If that execution holds together, the case for the current discount narrowing strengthens, but if costs, regulatory demands or earnings quality disappoint, the gap could prove to be a value trap rather than an opportunity.
This article by Simply Wall St is general in nature. We provide commentary based on historical data and analyst forecasts only using an unbiased methodology and our articles are not intended to be financial advice. It does not constitute a recommendation to buy or sell any stock, and does not take account of your objectives, or your financial situation. We aim to bring you long-term focused analysis driven by fundamental data. Note that our analysis may not factor in the latest price-sensitive company announcements or qualitative material. Simply Wall St has no position in any stocks mentioned.
Have feedback on this article? Concerned about the content? Get in touch with us directly. Alternatively, email editorial-team@simplywallst.com