
- PRICING
- LIVE QUOTES
- LEARN
- HELP


EN
ASICS (TSE:7936) Looks Fully Priced Following Its FP Movement Collaboration
ASICS (TSE:7936) has drawn fresh attention after announcing a limited edition footwear collaboration with FP Movement, pairing its performance running and tennis shoes with lifestyle focused designs tailored to women.
See our latest analysis for ASICS.
ASICS shares have shown firm momentum, with a 7.99% 7 day share price return and a 12.30% 30 day share price return, while the 1 year total shareholder return of 38.13% reflects strong longer term compounding.
If this collaboration has you thinking about where growth could come from next in sports and performance, it may be worth scanning 33 robotics and automation stocks
After a sharp run that leaves ASICS at ¥4,976 and still about 10% below analyst targets, the market appears cautious despite double digit revenue and net income growth. Does that hesitation match the valuation story that follows?
Price-to-Earnings of 31x: Is It Justified for ASICS?
ASICS currently trades on a P/E of 31x, which sits alongside a strong share price run and leaves investors asking whether the stock is priced too richly for its earnings power.
The P/E ratio compares the current share price to the company’s earnings per share and is a common way to gauge how much investors are paying for each unit of profit. For ASICS, that 31x multiple suggests the market is willing to pay a relatively high price for its earnings, especially given its position in the luxury and performance footwear space.
Against that backdrop, ASICS has grown earnings by 65.4% over the past year, faster than both its 51.5% 5 year average and the wider JP Luxury industry, which recorded 22% earnings growth according to the data provided. Analysts also expect earnings to grow annually, with forecasts pointing to revenue and profit growth ahead of the broader JP market, along with a high current Return on Equity of 35.8%. The question for investors is whether these strengths fully explain paying 31x earnings when a fair P/E based on regression analysis is estimated at 20.5x.
Relative to peers, the premium is clear. ASICS trades at 31x earnings compared with the JP Luxury industry average of 16.1x and a peer group average of 24.5x, which suggests the stock is valued more highly than many competitors. Against the estimated fair P/E of 20.5x, the current multiple also looks stretched, which hints at a level the market could eventually move toward if expectations cool or earnings do not keep pace with the price.
Explore the SWS fair ratio for ASICS
Result: Price-to-Earnings of 31x (OVERVALUED)
However, risks remain if ASICS stumbles on execution in key regions or if earnings growth slows. This could quickly challenge that premium 31x P/E.
Find out about the key risks to this ASICS narrative.
Another View: What Does The DCF Say About ASICS?
While the 31x P/E suggests ASICS is expensive, the SWS DCF model offers a slightly different angle. On that measure, the stock at ¥4,976 sits above an estimated future cash flow value of ¥4,599.54, pointing to a stock that screens as overvalued rather than cheap on cash flows.
That gap is not extreme, but it does imply limited margin of safety if forecasts or sentiment soften. If earnings growth is already well appreciated in the price, investors have to ask whether there is enough room for upside to justify paying above the model’s estimate of value.
For a closer look at how the DCF stacks up against the market price and what assumptions sit underneath it, Look into how the SWS DCF model arrives at its fair value.
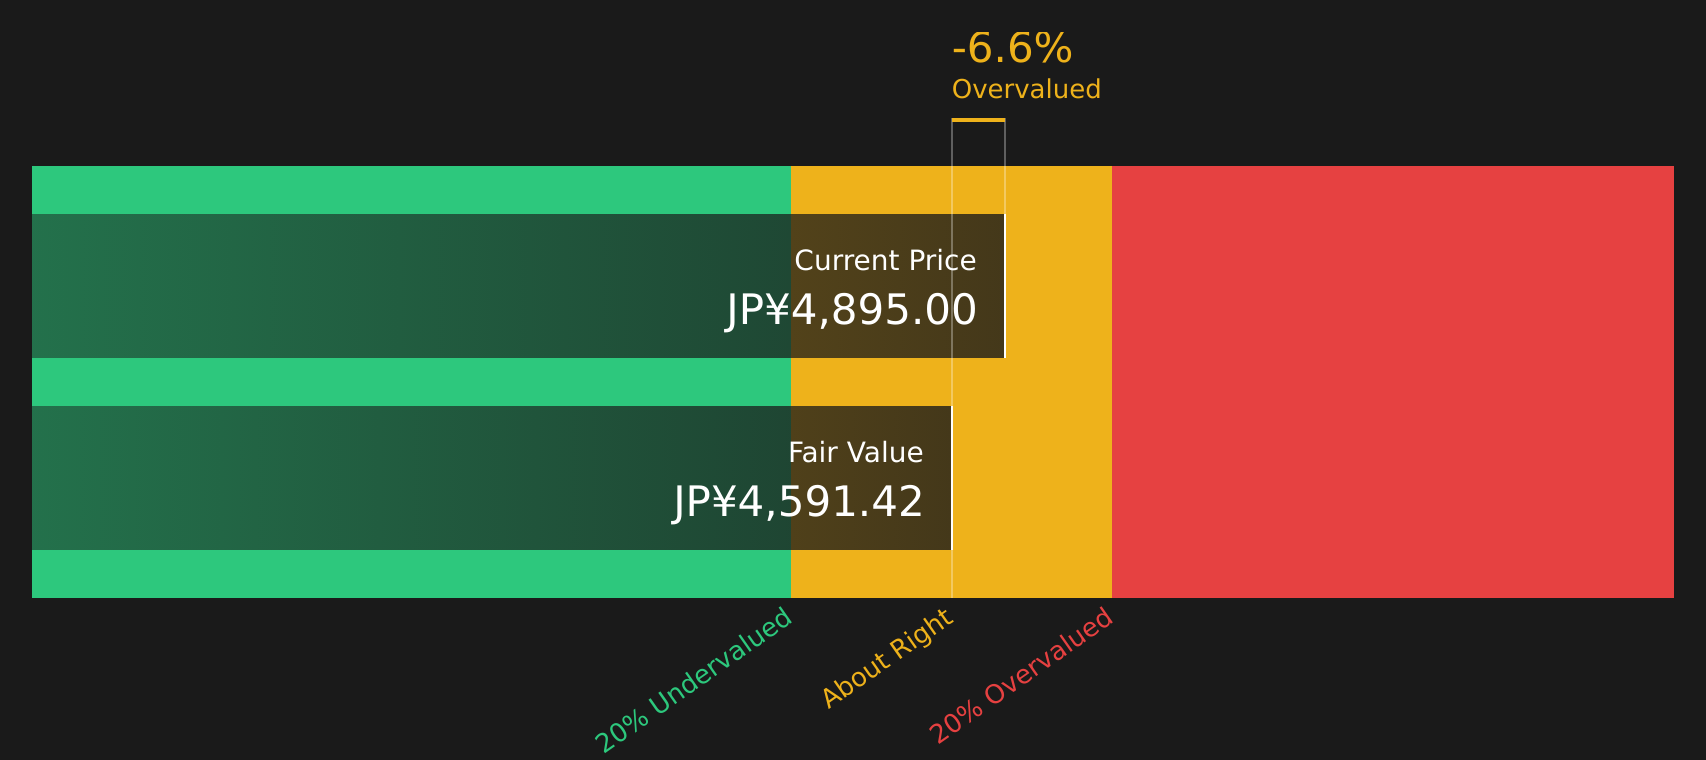
Simply Wall St performs a discounted cash flow (DCF) on every stock in the world every day (check out ASICS for example). We show the entire calculation in full. You can track the result in your watchlist or portfolio and be alerted when this changes, or use our stock screener to discover 15 high quality undervalued stocks. If you save a screener we even alert you when new companies match - so you never miss a potential opportunity.
Next Steps
With ASICS attracting both enthusiasm and caution, it makes sense to review the data directly and decide how the risk reward trade off looks to you. To weigh those signals side by side, start with the 2 key rewards and 1 important warning sign
Looking for more investment ideas beyond ASICS?
If ASICS has sharpened your focus on quality opportunities, do not stop here. Use the Simply Wall St Screener to spot other stocks that fit your style.
- Target resilient income by checking out 43 dividend fortresses that aim to combine higher yields with staying power through different market conditions.
- Hunt for potential bargains with 15 high quality undervalued stocks where solid cash flows and balance sheets might not yet be fully reflected in current prices.
- Secure more sleep at night by considering 52 resilient stocks with low risk scores that score well on financial strength and fewer red flags.
This article by Simply Wall St is general in nature. We provide commentary based on historical data and analyst forecasts only using an unbiased methodology and our articles are not intended to be financial advice. It does not constitute a recommendation to buy or sell any stock, and does not take account of your objectives, or your financial situation. We aim to bring you long-term focused analysis driven by fundamental data. Note that our analysis may not factor in the latest price-sensitive company announcements or qualitative material. Simply Wall St has no position in any stocks mentioned.
Have feedback on this article? Concerned about the content? Get in touch with us directly. Alternatively, email editorial-team@simplywallst.com