
- PRICING
- LIVE QUOTES
- LEARN
- HELP


EN
BlackRock (BLK) Stock May Be 6% Undervalued Despite Trump Accounts News
BlackRock stock is coming off a strong 3 year run. At around US$1,031 per share, the valuation picture is mixed, with the intrinsic value estimate from the Excess Returns model sitting close to the market price, while earnings based multiples point to a richer tag.
- Over the past 3 years, BlackRock has returned about 51.8%, which sets a relatively high bar for any further gains to be supported by fundamentals.
- Fresh momentum in ETFs, digital assets and tokenization can help support long term fee growth, but regulatory scrutiny and valuation questions in private credit and other private markets activities may weigh on how investors price the stock.
- With a value score of 3 out of 6, BlackRock screens as a mixed picture rather than a clear bargain or clear overvaluation on the broader checks.
The issue now is whether BlackRock's current price already reflects this balance between growth opportunities and the risks tied to its richer multiples.
Find out why BlackRock's -5.2% return over the last year is lagging behind its peers.
Does BlackRock Look Fairly Valued on Excess Returns?
The Excess Returns model looks at how much value BlackRock creates above its cost of equity, using projected returns on equity and book value growth to estimate what the stock should be worth today. For BlackRock, book value is set at $364.87 per share, with stable earnings per share of $61.55 based on forward return on equity estimates from 7 analysts.
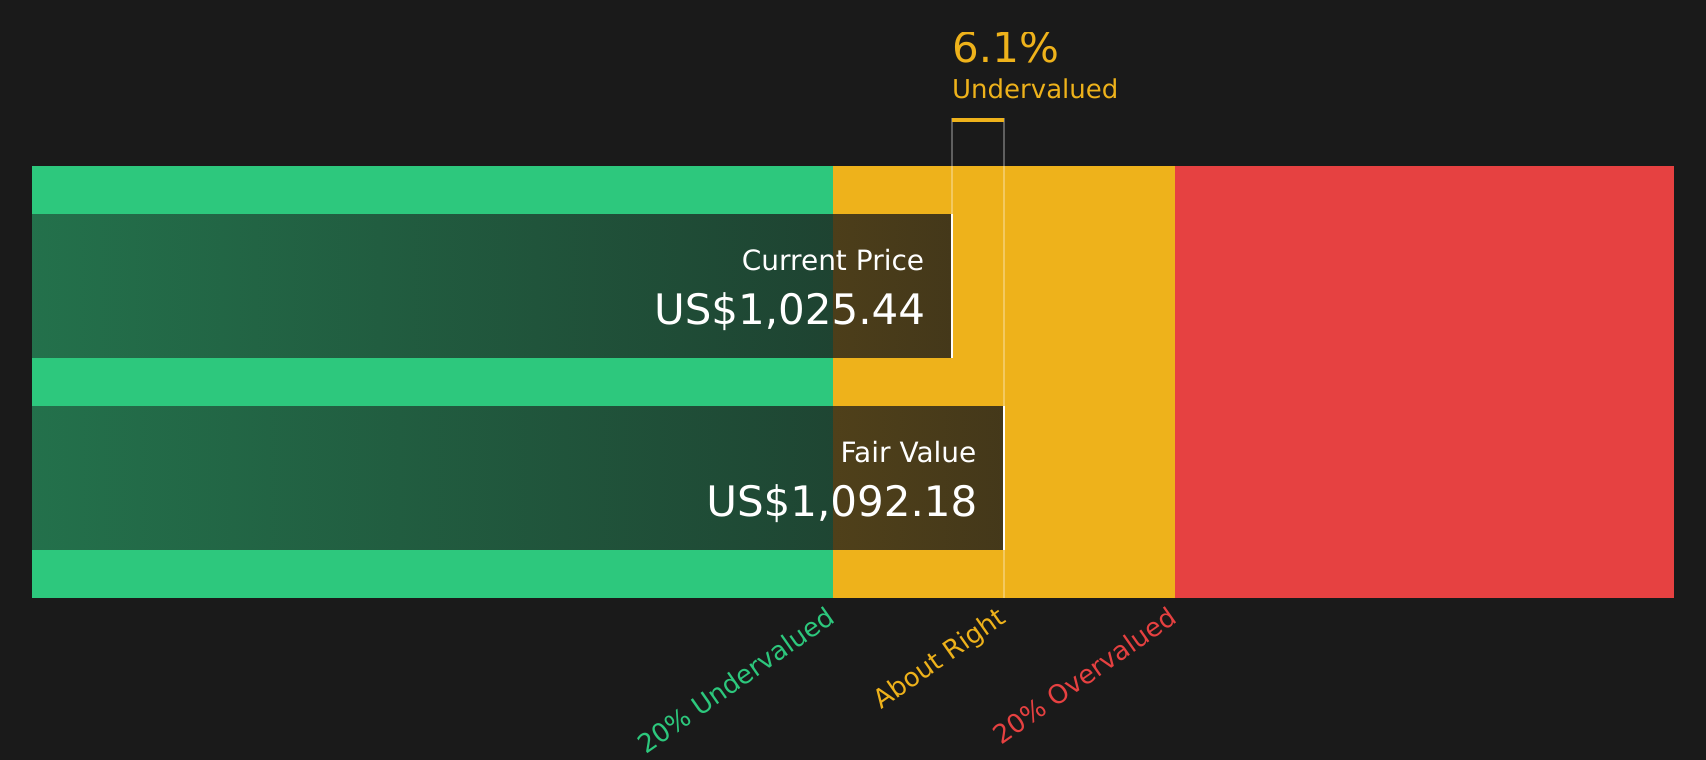
With an average return on equity of 16.50% and a cost of equity of $29.61 per share, the model calculates an excess return of $31.94 per share on a stable book value base of $372.98. Taken together, this supports an intrinsic value estimate of about $1,099 per share. This is close to where BlackRock trades around $1,031, which implies the stock is roughly fairly valued with a small 6.1% discount. The U.S. Treasury’s selection of BlackRock ETFs for the new Trump Accounts program helps explain why the market is comfortable keeping the stock near its intrinsic value.
Overall, the Excess Returns work up suggests BlackRock currently screens as about fairly valued rather than a clear bargain or an obvious stretch.
BlackRock is fairly valued according to our Excess Returns, but this can change at a moment's notice. Track the value in your watchlist or portfolio and be alerted on when to act.
Has BlackRock Run Too Far on Earnings?
The P/E ratio fits BlackRock well because earnings are still the main anchor for how investors value a large, fee based asset manager. On this lens, BlackRock trades on a P/E of about 25.6x, which is below the broader Capital Markets industry average of 40.1x but comfortably above the peer group average of 17.5x.
A fair P/E multiple that adjusts for BlackRock's size, profitability profile and risk comes out closer to 19.6x, which is lower than where the stock trades today. That gap indicates investors are paying a premium relative to what the tailored fair ratio implies, even though the multiple does not appear elevated compared with the wider industry.
On the P/E check alone, BlackRock stock appears overvalued relative to the level that the fair multiple framework implies.

See what the numbers say about this price — find out in our valuation breakdown.
The BlackRock Narrative: What Would Justify Today's Price?
Simply Wall St Narratives for BlackRock pick up where the valuation checks leave off by spelling out which paths for BlackRock's future growth, margins and earnings would need to hold for the stock to be worth meaningfully more or less than today's price on the Community page. Each narrative links its number to a clear view of how growth, profitability and key risks could evolve, giving you a reference point you can revisit as new information comes through.
One of the top community narratives on BlackRock: 18% undervalued
"BlackRock's expansion into private markets through acquisitions like HPS Investment Partners, GIP, and ElmTree positions the company to capitalize on the secular shift of institutional assets into alternatives and infrastructure…"
Read one of the top narratives on BlackRock
Do you think there's more to the story for BlackRock? Head over to our Community to see what others are saying!
The Bottom Line
For BlackRock, the Excess Returns intrinsic value estimate and the broader checks point to a stock that no longer looks obviously cheap, while the P/E work suggests investors are already paying up for its earnings profile. That mix leaves a balanced but not compelling valuation case, with neither clear undervaluation nor an extreme premium. From here, the real swing factor is whether BlackRock can deliver the growth and fee durability investors are implicitly baking into the current multiple, particularly around ETFs and private markets, without regulatory or valuation risks in those areas eroding confidence in that premium.
This article by Simply Wall St is general in nature. We provide commentary based on historical data and analyst forecasts only using an unbiased methodology and our articles are not intended to be financial advice. It does not constitute a recommendation to buy or sell any stock, and does not take account of your objectives, or your financial situation. We aim to bring you long-term focused analysis driven by fundamental data. Note that our analysis may not factor in the latest price-sensitive company announcements or qualitative material. Simply Wall St has no position in any stocks mentioned.
Have feedback on this article? Concerned about the content? Get in touch with us directly. Alternatively, email editorial-team@simplywallst.com