
- PRICING
- LIVE QUOTES
- LEARN
- HELP


EN
Yue Yuen Industrial (Holdings) (SEHK:551) Reports June Revenue, Is The Stock Fairly Valued?
Yue Yuen Industrial (Holdings) (SEHK:551) has drawn fresh attention after reporting unaudited net operating revenue of US$593.9m for June 2026 and US$3.97b for the year to date, giving investors updated visibility on current trading.
See our latest analysis for Yue Yuen Industrial (Holdings).
The latest trading update comes as Yue Yuen Industrial (Holdings)’ share price of HK$12.91 sits after a period where the stock has fallen 19.16% on a year to date share price return, yet delivered a 14.38% one year total shareholder return. This hints at earlier income or reinvested dividends supporting longer term holders even as recent momentum has cooled.
If this revenue update has you looking beyond Yue Yuen Industrial (Holdings), it could be a good moment to screen for other manufacturers and consumer brands through a discovery tool like 105 top founder-led companies
So is Yue Yuen Industrial (Holdings)’ weaker recent share price pointing to pressure on the underlying business, or has sentiment moved faster than the fundamentals, making valuation the real issue to focus on next?
Preferred P/E of 7.8x: Is it justified?
On current numbers, Yue Yuen Industrial (Holdings) trades on a P/E of 7.8x, which screens as slightly expensive against its peer group average of 7.5x, yet still supported by its broader valuation checks.
The P/E ratio compares the company’s share price with its earnings per share, so it gives you a quick read on how much the market is paying for Yue Yuen Industrial (Holdings)' current earnings stream.
Here, the picture is mixed. On one hand, the stock is described as expensive relative to its peer average P/E of 7.5x, suggesting the market is assigning a modest premium to its earnings. On the other hand, the P/E sits below the Hong Kong Luxury industry average of 8.4x and is also close to the estimated fair P/E of 7.9x, a level our models suggest the market could logically gravitate toward if assumptions hold.
Explore the SWS fair ratio for Yue Yuen Industrial (Holdings)
Result: Price-to-earnings of 7.8x (ABOUT RIGHT)
However, Yue Yuen Industrial (Holdings) still faces risks if its key branded customers shift orders elsewhere, or if recent share price weakness weighs on investor confidence.
Find out about the key risks to this Yue Yuen Industrial (Holdings) narrative.
Another View: DCF Points to Deeper Value at Yue Yuen Industrial (Holdings)
While the P/E of 7.8x suggests Yue Yuen Industrial (Holdings) is roughly in line with what the market pays for comparable earnings, the SWS DCF model tells a different story. On those cash flow assumptions, a fair value of HK$28.75 versus a share price of HK$12.91 implies the stock trades at a 55.1% discount. If both signals are correct, is the gap about market caution, or is the DCF being too optimistic?
Look into how the SWS DCF model arrives at its fair value.
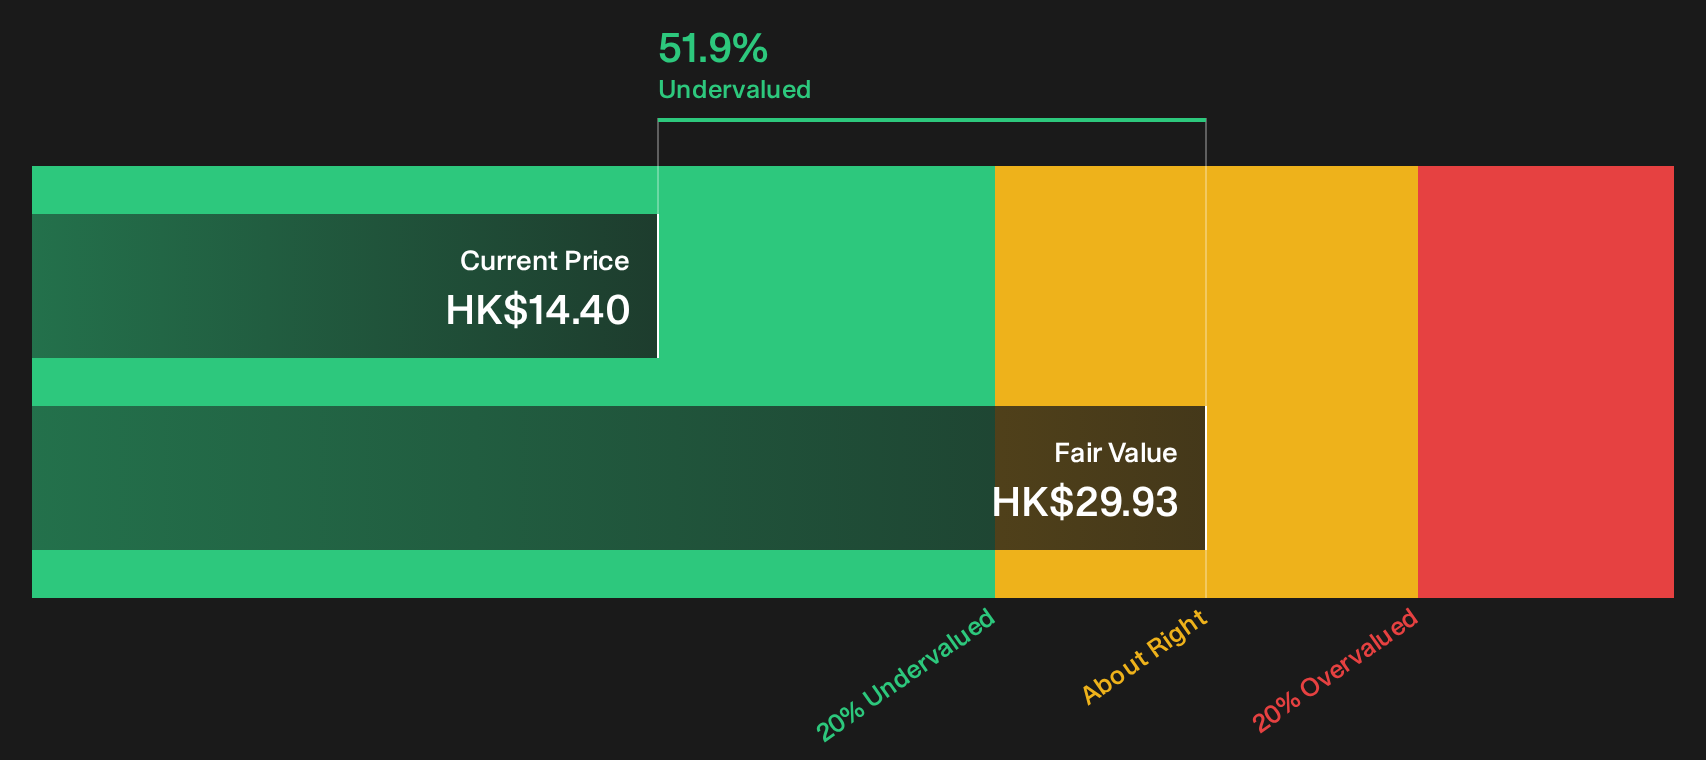
Simply Wall St performs a discounted cash flow (DCF) on every stock in the world every day (check out Yue Yuen Industrial (Holdings) for example). We show the entire calculation in full. You can track the result in your watchlist or portfolio and be alerted when this changes, or use our stock screener to discover 217 high quality undervalued stocks. If you save a screener we even alert you when new companies match - so you never miss a potential opportunity.
Next Steps
Unsure whether the tone around Yue Yuen Industrial (Holdings) is too cautious or not cautious enough? Take a closer look at the data, weigh the trade off between concerns and potential upsides, and shape your own stance with the 2 key rewards and 1 important warning sign.
Looking for more investment ideas beyond Yue Yuen Industrial (Holdings)?
If you want a broader view than Yue Yuen Industrial (Holdings) alone, fresh stock ideas from structured screeners can help you compare business quality, income potential, and risks quickly.
Use these tailored screeners to uncover opportunities that fit your style before the market focuses on them:
- Target potential mispricing by reviewing companies that appear attractively valued with resilient fundamentals through the 217 high quality undervalued stocks.
- Strengthen your income stream by checking out companies in the 474 dividend fortresses that offer higher yields with a focus on stability.
- Prioritise resilience by focusing on companies highlighted in the 292 resilient stocks with low risk scores that score well on financial health and downside protection.
This article by Simply Wall St is general in nature. We provide commentary based on historical data and analyst forecasts only using an unbiased methodology and our articles are not intended to be financial advice. It does not constitute a recommendation to buy or sell any stock, and does not take account of your objectives, or your financial situation. We aim to bring you long-term focused analysis driven by fundamental data. Note that our analysis may not factor in the latest price-sensitive company announcements or qualitative material. Simply Wall St has no position in any stocks mentioned.
Have feedback on this article? Concerned about the content? Get in touch with us directly. Alternatively, email editorial-team@simplywallst.com