
- PRICING
- LIVE QUOTES
- LEARN
- HELP


EN
IGO (ASX:IGO) Leans On Greenbushes Recovery, Is It Trading Below Fair Value?
Why Greenbushes Is Now Central to IGO's Story
IGO (ASX:IGO) has drawn fresh investor attention as efforts to restore performance at its Greenbushes lithium operation coincide with support from stronger lithium prices, while legacy nickel operations progressively wind down.
With Greenbushes now the company’s main long term lithium asset, recent market interest is centered on how production reliability, operating costs, and on the ground improvement work might influence IGO’s earnings profile and risk balance.
See our latest analysis for IGO.
IGO’s recent share price has been under pressure, with the stock down 22.23% on a 1 month share price return basis and 16.08% on a year to date share price return basis. At the same time, the 1 year total shareholder return sits at 49.78%, reflecting how changing expectations around Greenbushes and the wind down of nickel operations are influencing momentum.
If you want to see how other battery metal producers are trading as sentiment shifts around electrification supply chains, take a look at our screener of 30 best rare earth metal stocks
Bulls view IGO as a recovery story driven by Greenbushes, while bears highlight recent share price weakness and current losses. Based on the latest numbers, which side does the valuation evidence support next?
Preferred Price-to-Sales of 11.9x for IGO: Is it justified?
Based on current data, IGO trades on a Price-to-Sales (P/S) ratio of 11.9x, which screens as expensive relative to both its own fair ratio estimate and peer averages.
The P/S multiple compares the A$6.89 share price to the company’s A$437.9m of revenue, giving a quick sense of how much investors are paying for each dollar of sales. For IGO, the modelled fair P/S ratio is 0.3x, and peer companies in the sector sit around 7.5x. The current 11.9x level therefore indicates that the stock price incorporates materially richer expectations than both those reference points.
Compared with the Australian Metals and Mining industry, IGO’s P/S of 11.9x is well below the industry’s very large average of 76.6x. On this single metric, it appears cheaper than many domestic metals and mining peers. However, relative to the estimated fair P/S ratio of 0.3x and the peer group at 7.5x, the current multiple still looks demanding and indicates that there may be limited room if sentiment or sales expectations weaken from here.
Explore the SWS fair ratio for IGO
Result: Price-to-Sales of 11.9x (OVERVALUED)
However, the weak recent share price returns and current net loss of A$206.6m mean any setback at Greenbushes or further revenue contraction could quickly challenge the IGO recovery story.
Find out about the key risks to this IGO narrative.
Another View on IGO: SWS DCF Points the Other Way
While the P/S ratio paints IGO as expensive, the SWS DCF model suggests a different story, with an estimated fair value of A$9.96 versus the current A$6.89. This implies the stock trades at a 30.9% discount. Which signal do you treat as more important?
Look into how the SWS DCF model arrives at its fair value.
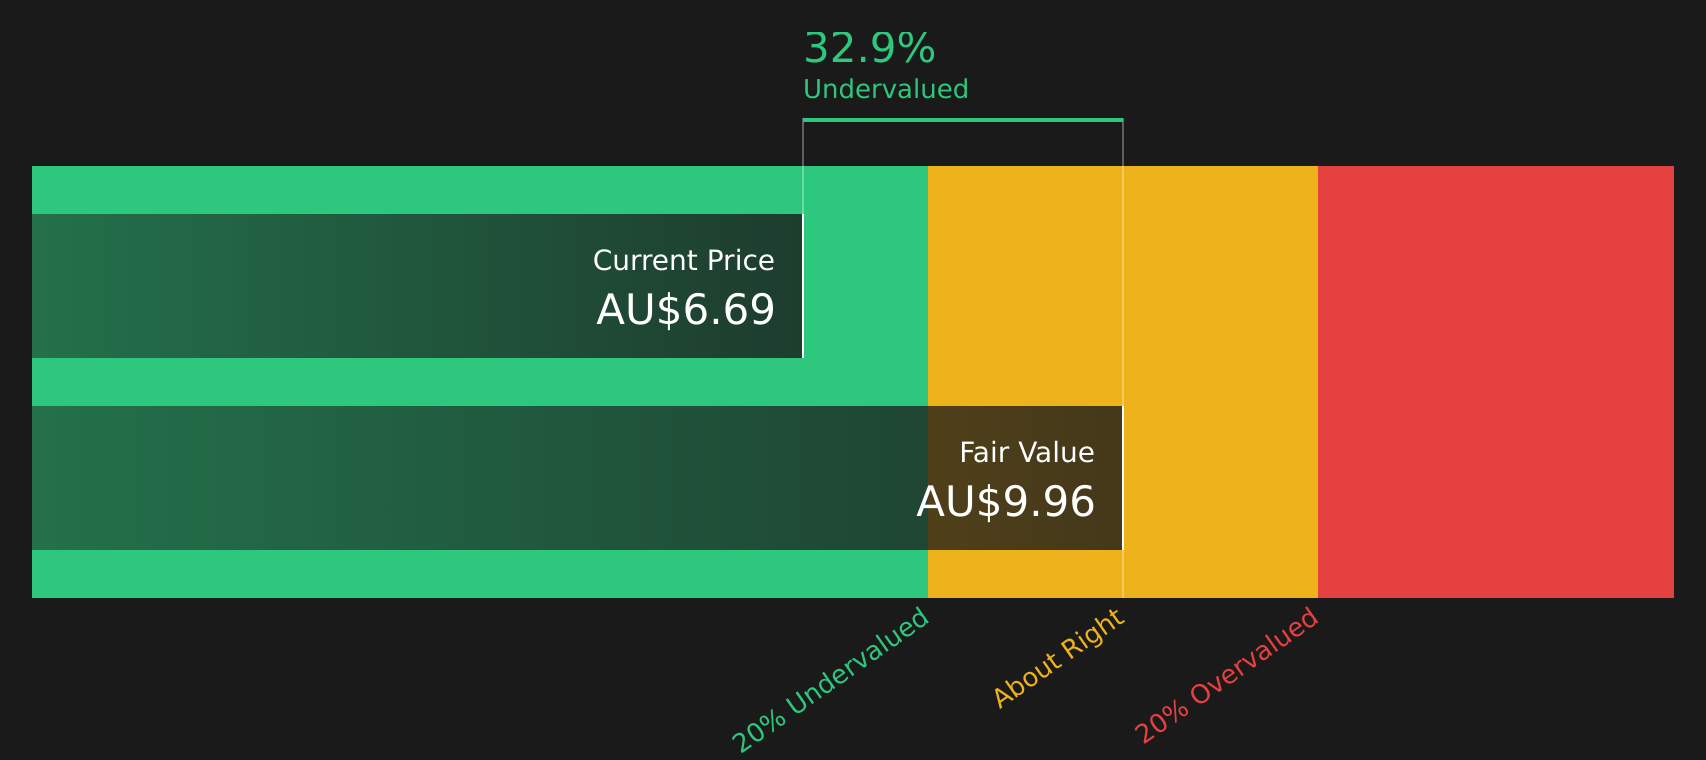
Simply Wall St performs a discounted cash flow (DCF) on every stock in the world every day (check out IGO for example). We show the entire calculation in full. You can track the result in your watchlist or portfolio and be alerted when this changes, or use our stock screener to discover 10 high quality undervalued stocks. If you save a screener we even alert you when new companies match - so you never miss a potential opportunity.
Next Steps
With mixed signals on IGO’s valuation and sentiment already split, it makes sense to look through the underlying data and decide where you stand. To see what is driving optimism, review the 2 key rewards
Looking for more investment ideas beyond IGO?
While IGO might be on your radar, some of the most interesting opportunities often sit just outside your current watchlist, so do not miss what else is out there.
- Spot potential high growth opportunities early by scanning 59 elite penny stocks with strong financials that already show stronger financial foundations than many peers.
- Zero in on value by reviewing 10 high quality undervalued stocks that combine solid balance sheets with attractive pricing signals.
- Dial back portfolio stress by assessing 8 resilient stocks with low risk scores that score well on resilience and financial strength.
This article by Simply Wall St is general in nature. We provide commentary based on historical data and analyst forecasts only using an unbiased methodology and our articles are not intended to be financial advice. It does not constitute a recommendation to buy or sell any stock, and does not take account of your objectives, or your financial situation. We aim to bring you long-term focused analysis driven by fundamental data. Note that our analysis may not factor in the latest price-sensitive company announcements or qualitative material. Simply Wall St has no position in any stocks mentioned.
Have feedback on this article? Concerned about the content? Get in touch with us directly. Alternatively, email editorial-team@simplywallst.com