
- PRICING
- LIVE QUOTES
- LEARN
- HELP


EN
3 Stocks Estimated To Be Trading Below Their True Value In July 2026
Over the last 7 days, the United States market has risen by 1.4%, contributing to a robust annual climb of 19%, with earnings forecasted to grow by 19% annually. In this environment, identifying stocks that are potentially trading below their true value can offer investors opportunities for growth as they align with the market's upward trajectory and anticipated earnings expansion.
Top 10 Undervalued Stocks Based On Cash Flows In The United States
| Name | Current Price | Fair Value (Est) | Discount (Est) |
| Victoria's Secret (VSXY) | $76.71 | $149.80 | 48.8% |
| Rayonier (RYN) | $21.49 | $42.95 | 50% |
| Q2 Holdings (QTWO) | $52.63 | $103.81 | 49.3% |
| Procore Technologies (PCOR) | $43.97 | $87.81 | 49.9% |
| Pattern Group (PTRN) | $26.43 | $52.09 | 49.3% |
| Natera (NTRA) | $279.32 | $543.40 | 48.6% |
| Janus Living (JAN) | $29.12 | $57.58 | 49.4% |
| Esquire Financial Holdings (ESQ) | $120.34 | $238.84 | 49.6% |
| Betterware de MéxicoP.I. de (BWMX) | $17.98 | $35.88 | 49.9% |
| Beacon Financial (BBT) | $30.22 | $60.06 | 49.7% |
Let's review some notable picks from our screened stocks.
Hesai Group (HSAI)
Overview: Hesai Group develops, manufactures, and sells three-dimensional LiDAR solutions across Mainland China, Europe, North America, and internationally with a market cap of $2.85 billion.
Operations: Hesai Group generates revenue from the development, manufacturing, and sale of three-dimensional LiDAR solutions across various global markets including Mainland China, Europe, and North America.
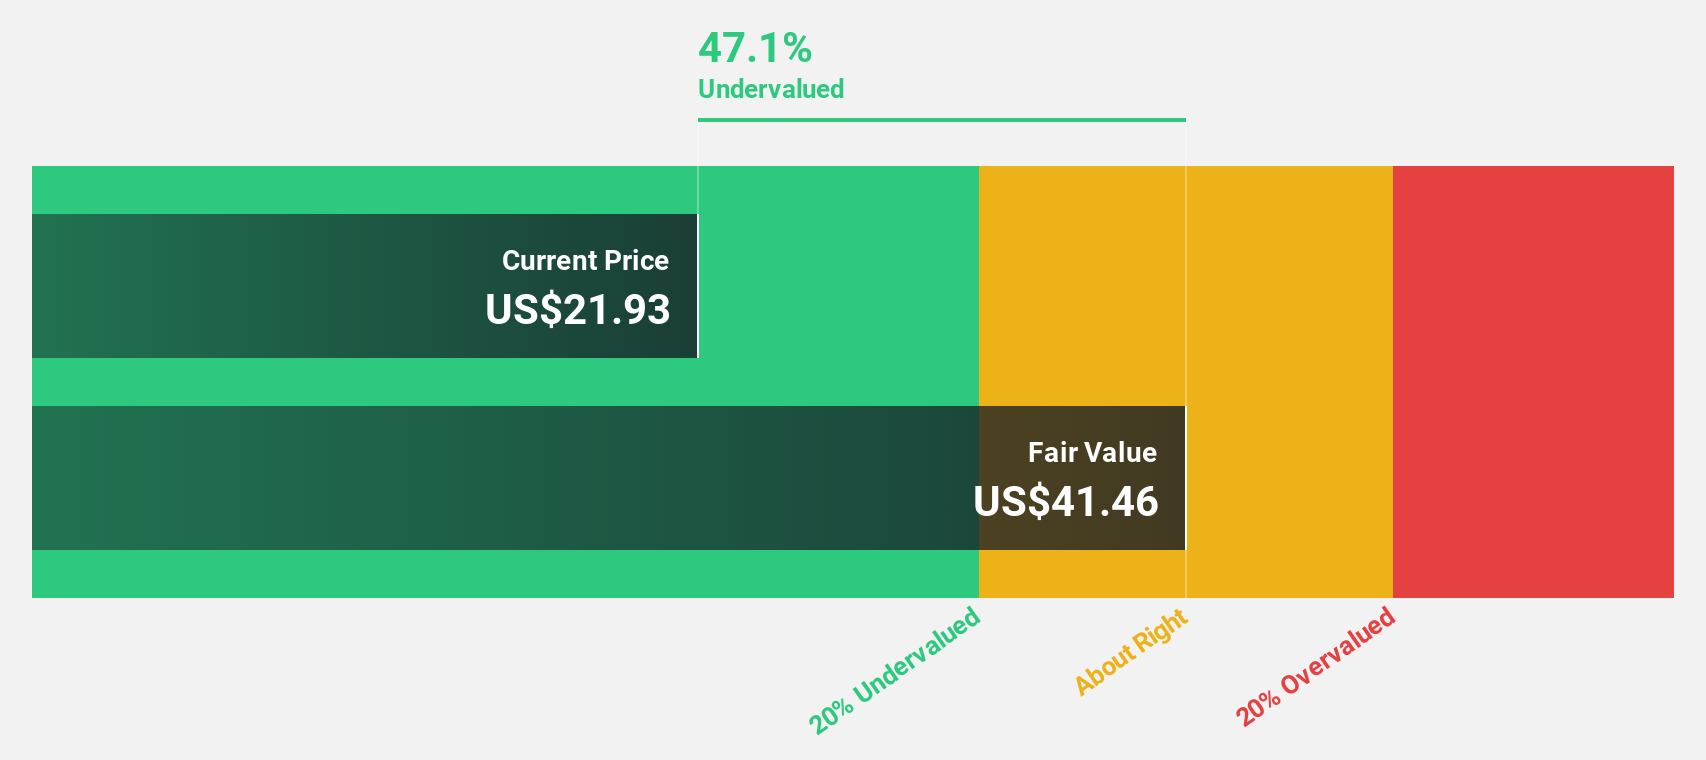
Estimated Discount To Fair Value: 10.2%
Hesai Group's recent financial performance shows a transition to profitability, with first-quarter net income of CNY 18.32 million from a prior loss. The company is trading at 10.2% below its estimated fair value, suggesting it may be undervalued based on cash flows. Analysts forecast significant earnings growth of 27.4% annually, outpacing the US market average, supported by strategic partnerships and robust lidar technology adoption across automotive and robotics sectors.
- Our comprehensive growth report raises the possibility that Hesai Group is poised for substantial financial growth.
- Click to explore a detailed breakdown of our findings in Hesai Group's balance sheet health report.
Intapp (INTA)
Overview: Intapp, Inc., through its subsidiary Integration Appliance, Inc., offers AI-powered solutions across the United States, the United Kingdom, and internationally with a market cap of approximately $2.11 billion.
Operations: The company's revenue primarily comes from its Software & Programming segment, generating $560.31 million.
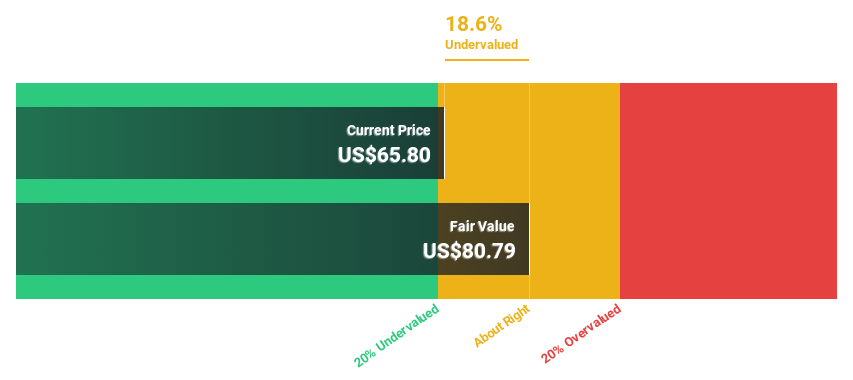
Estimated Discount To Fair Value: 47.8%
Intapp is trading at US$27.39, significantly below its estimated future cash flow value of US$52.44, highlighting potential undervaluation based on cash flows. Despite a net loss in recent quarters, revenue growth outpaces the broader market at 13.6% annually, and profitability is anticipated within three years. Recent client wins with Ropes & Gray and Arkwright Consulting underscore Intapp's expanding footprint in deal management solutions, potentially enhancing its financial outlook further through strategic partnerships and AI-driven innovations.
- Our earnings growth report unveils the potential for significant increases in Intapp's future results.
- Dive into the specifics of Intapp here with our thorough financial health report.
Wealthfront (WLTH)
Overview: Wealthfront Corporation is a privately owned investment manager with a market cap of $1.40 billion.
Operations: The company's revenue segment is primarily derived from Asset Management, totaling $370.96 million.
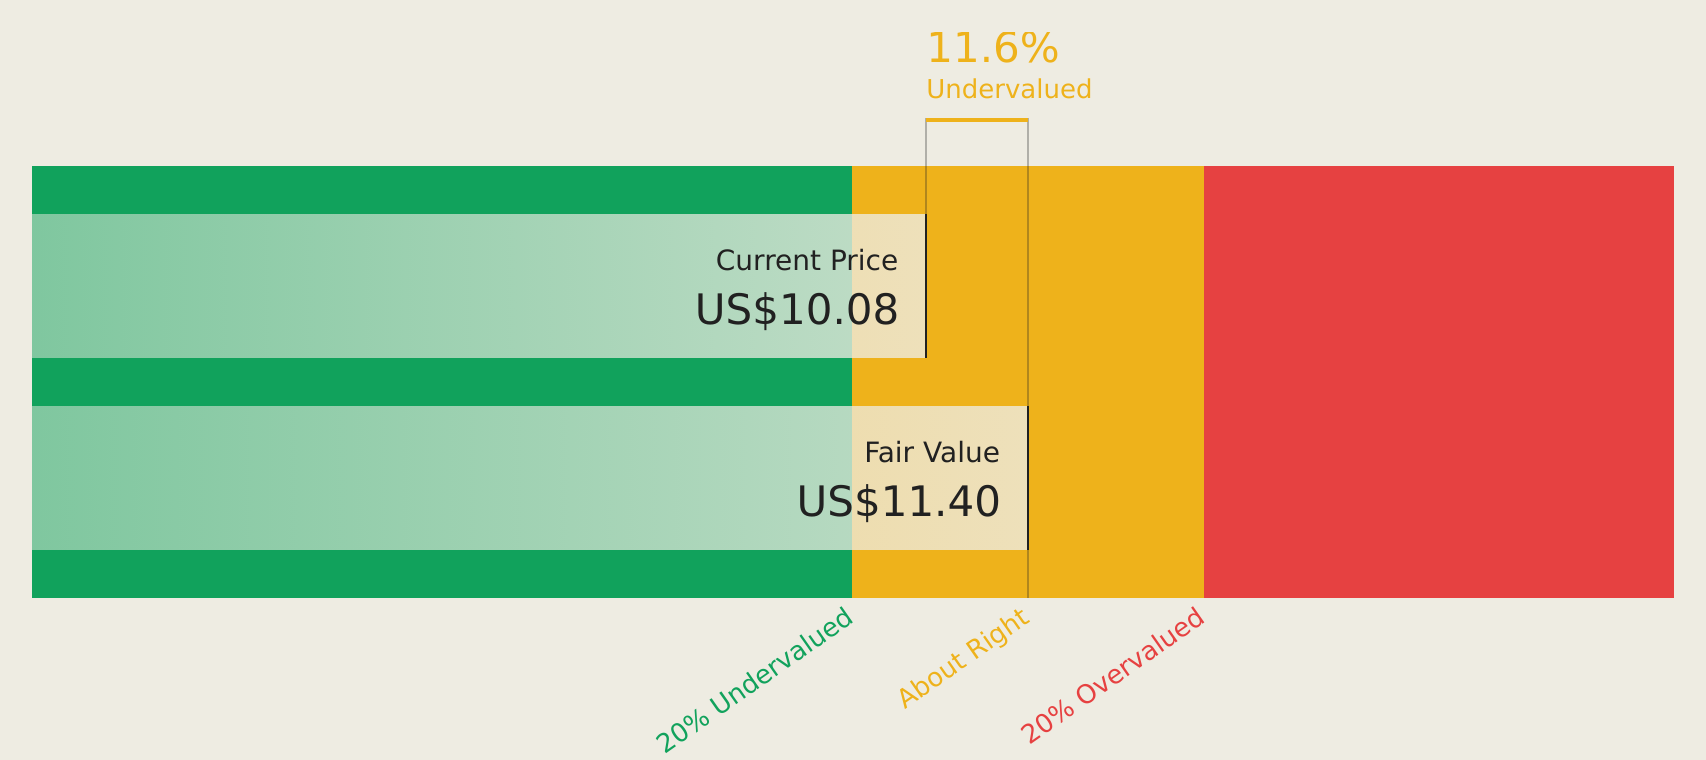
Estimated Discount To Fair Value: 46.3%
Wealthfront, currently trading at US$9.14, is significantly undervalued relative to its estimated future cash flow value of US$17.01. The company's revenue growth of 14.8% annually outpaces the broader U.S. market, and it is projected to achieve profitability within three years. Recent product expansions like the Custodial Account enhance Wealthfront's offerings in family wealth management, potentially supporting its financial performance despite a recent decline in net income compared to last year’s earnings results.
- According our earnings growth report, there's an indication that Wealthfront might be ready to expand.
- Click here and access our complete balance sheet health report to understand the dynamics of Wealthfront.
Summing It All Up
- Discover the full array of 147 Undervalued US Stocks Based On Cash Flows right here.
- Are any of these part of your asset mix? Tap into the analytical power of Simply Wall St's portfolio to get a 360-degree view on how they're shaping up.
- Invest smarter with the free Simply Wall St app providing detailed insights into every stock market around the globe.
Want To Explore Some Alternatives?
- Explore high-performing small cap companies that haven't yet garnered significant analyst attention.
- Diversify your portfolio with solid dividend payers offering reliable income streams to weather potential market turbulence.
- Fuel your portfolio with companies showing strong growth potential, backed by optimistic outlooks both from analysts and management.
This article by Simply Wall St is general in nature. We provide commentary based on historical data and analyst forecasts only using an unbiased methodology and our articles are not intended to be financial advice. It does not constitute a recommendation to buy or sell any stock, and does not take account of your objectives, or your financial situation. We aim to bring you long-term focused analysis driven by fundamental data. Note that our analysis may not factor in the latest price-sensitive company announcements or qualitative material. Simply Wall St has no position in any stocks mentioned.
Have feedback on this article? Concerned about the content? Get in touch with us directly. Alternatively, email editorial-team@simplywallst.com