
- PRICING
- LIVE QUOTES
- LEARN
- HELP


EN
Is Manhattan Associates (MANH) Fully Valued Following Its Russell 1000 Index Removal?
Index Removal Puts Manhattan Associates Back in Focus
Manhattan Associates (MANH) was recently removed from the Russell 1000 Dynamic Index, an event that can influence how index-tracking funds and some institutional investors position around the stock.
For you as an individual investor, index changes like this are often less about company operations and more about how trading flows and liquidity might shift in the short term. That can create periods where price movements reflect technical factors rather than fresh information about the underlying business.
See our latest analysis for Manhattan Associates.
At a share price of $146.41, Manhattan Associates has recently seen a 1-day share price return of 5.14% and a 7-day share price return of 11.87%, but the 1-year total shareholder return is down 26.32%. This suggests that recent momentum has picked up after a weaker longer stretch as investors reassess growth prospects and risk following the index removal.
If the Russell adjustment has you thinking about where else capital might move, it can be useful to widen the lens and look at 20 top founder-led companies
With Manhattan Associates trading at $146.41, currently at a reported discount to some valuation estimates yet following a 1-year total return that is down 26.32%, is there still a potential opportunity here or is the market already accounting for future growth in the price?
Most Popular Narrative: 1% Overvalued
Manhattan Associates closed at $146.41, which sits slightly above the most widely followed fair value estimate of $145 that is built on detailed analyst assumptions.
The assumed bearish price target for Manhattan Associates is $145.0, which represents up to two standard deviations below the consensus price target of $184.0. This valuation is based on what can be assumed as the expectations of Manhattan Associates's future earnings growth, profit margins and other risk factors from analysts on the more bearish end of the spectrum.
The core narrative focuses on steady revenue growth, improving margins, and a premium future earnings multiple that remains above many software peers. Curious how those moving parts fit together into a fair value so close to today’s price?
Result: Fair Value of $145 (OVERVALUED)
Have a read of the narrative in full and understand what's behind the forecasts.
However, if Manhattan Associates continues to report strong cloud and services demand and wins more third party AI and platform partnerships, that could challenge this cautious view.
Find out about the key risks to this Manhattan Associates narrative.
Another View: SWS DCF Model Suggests Undervaluation
While the bearish analyst narrative pegs Manhattan Associates at a fair value of $145 and labels the stock as slightly overvalued, the Simply Wall St DCF model points the other way. On those cash flow assumptions, Manhattan Associates at $146.41 screens as undervalued versus an estimated future cash flow value of $252.30. Which lens do you trust more when cash flows and earnings multiples tell different stories?
Look into how the SWS DCF model arrives at its fair value.
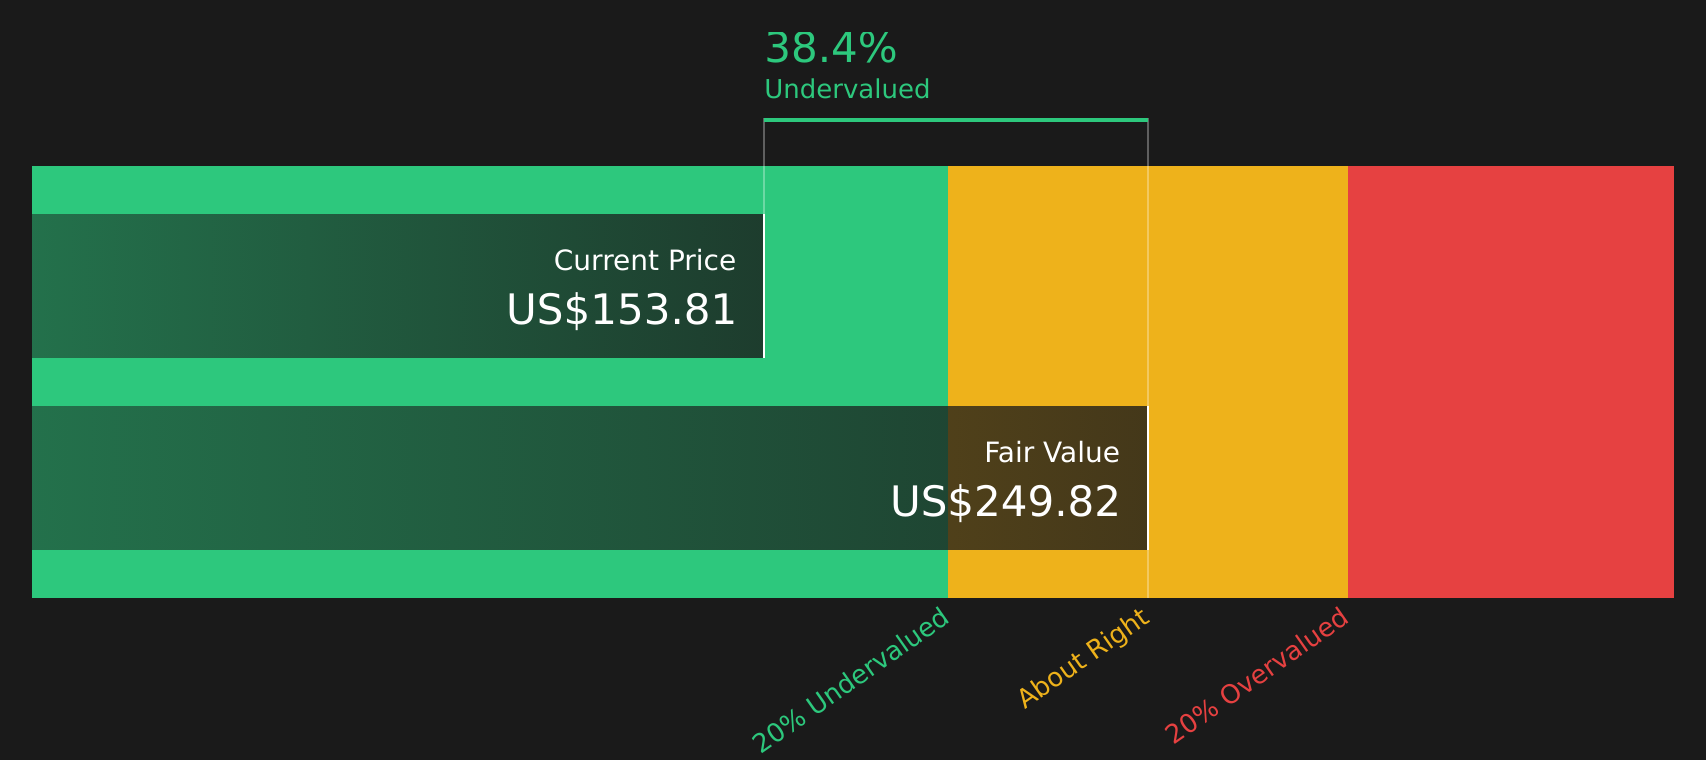
Simply Wall St performs a discounted cash flow (DCF) on every stock in the world every day (check out Manhattan Associates for example). We show the entire calculation in full. You can track the result in your watchlist or portfolio and be alerted when this changes, or use our stock screener to discover 41 high quality undervalued stocks. If you save a screener we even alert you when new companies match - so you never miss a potential opportunity.
Next Steps
With mixed signals around Manhattan Associates, do you see more to like or more to question, and how quickly do you want to firm up that view? Take a closer look at both sides of the story through 3 key rewards and 1 important warning sign
Looking for more investment ideas beyond Manhattan Associates?
If Manhattan Associates has sharpened your focus on valuation and risk, now is the time to widen your watchlist and look for fresh opportunities using curated stock ideas.
- Spot potential value plays early by scanning 41 high quality undervalued stocks that pair solid fundamentals with prices that may not fully reflect their underlying metrics.
- Strengthen your defensive side by reviewing 73 resilient stocks with low risk scores that score well on resilience and may help balance more volatile positions.
- Look for potential future standouts in the screener containing 19 high quality undiscovered gems before they sit firmly on everyone else's radar.
This article by Simply Wall St is general in nature. We provide commentary based on historical data and analyst forecasts only using an unbiased methodology and our articles are not intended to be financial advice. It does not constitute a recommendation to buy or sell any stock, and does not take account of your objectives, or your financial situation. We aim to bring you long-term focused analysis driven by fundamental data. Note that our analysis may not factor in the latest price-sensitive company announcements or qualitative material. Simply Wall St has no position in any stocks mentioned.
Have feedback on this article? Concerned about the content? Get in touch with us directly. Alternatively, email editorial-team@simplywallst.com