
- PRICING
- LIVE QUOTES
- LEARN
- HELP


EN
Ternium (TX) Stock After 55% Yearly Gain Is There Still Value?
- If you are wondering whether Ternium stock still offers value after its recent run, or if the easy gains are behind it, this article walks through what the current price might be implying.
- Ternium recently closed at US$45.37, with the share price down 2.0% over the past week and 8.2% over the past month, but still showing gains of 15.9% year to date and 55.0% over the past year.
- Recent coverage of Ternium has focused on how the company is positioned within the materials sector and what that could mean for its long term earnings potential. Commentary has also highlighted investor attention on capital allocation and balance sheet strength, which provides useful context for the share price moves.
- On Simply Wall St's valuation checks, Ternium currently has a valuation score of 5 out of 6. The rest of this article will walk through what that means across different valuation methods, and then finish with a broader framework that can help you think about value beyond any single model.
Find out why Ternium's 55.0% return over the last year is lagging behind its peers.
Approach 1: Ternium Discounted Cash Flow (DCF) Analysis
A Discounted Cash Flow, or DCF, model takes Ternium’s projected future cash flows, discounts them back to today using a required return, and sums them to estimate what the stock could be worth now.
For Ternium, the model used is a 2 Stage Free Cash Flow to Equity approach. The latest twelve month Free Cash Flow is about $484.9 million. Analyst estimates and extrapolations then extend out over the next decade, with projected Free Cash Flow of $887.0 million in 2028 and a set of estimated values through to 2035, all expressed in dollars and discounted back to today.
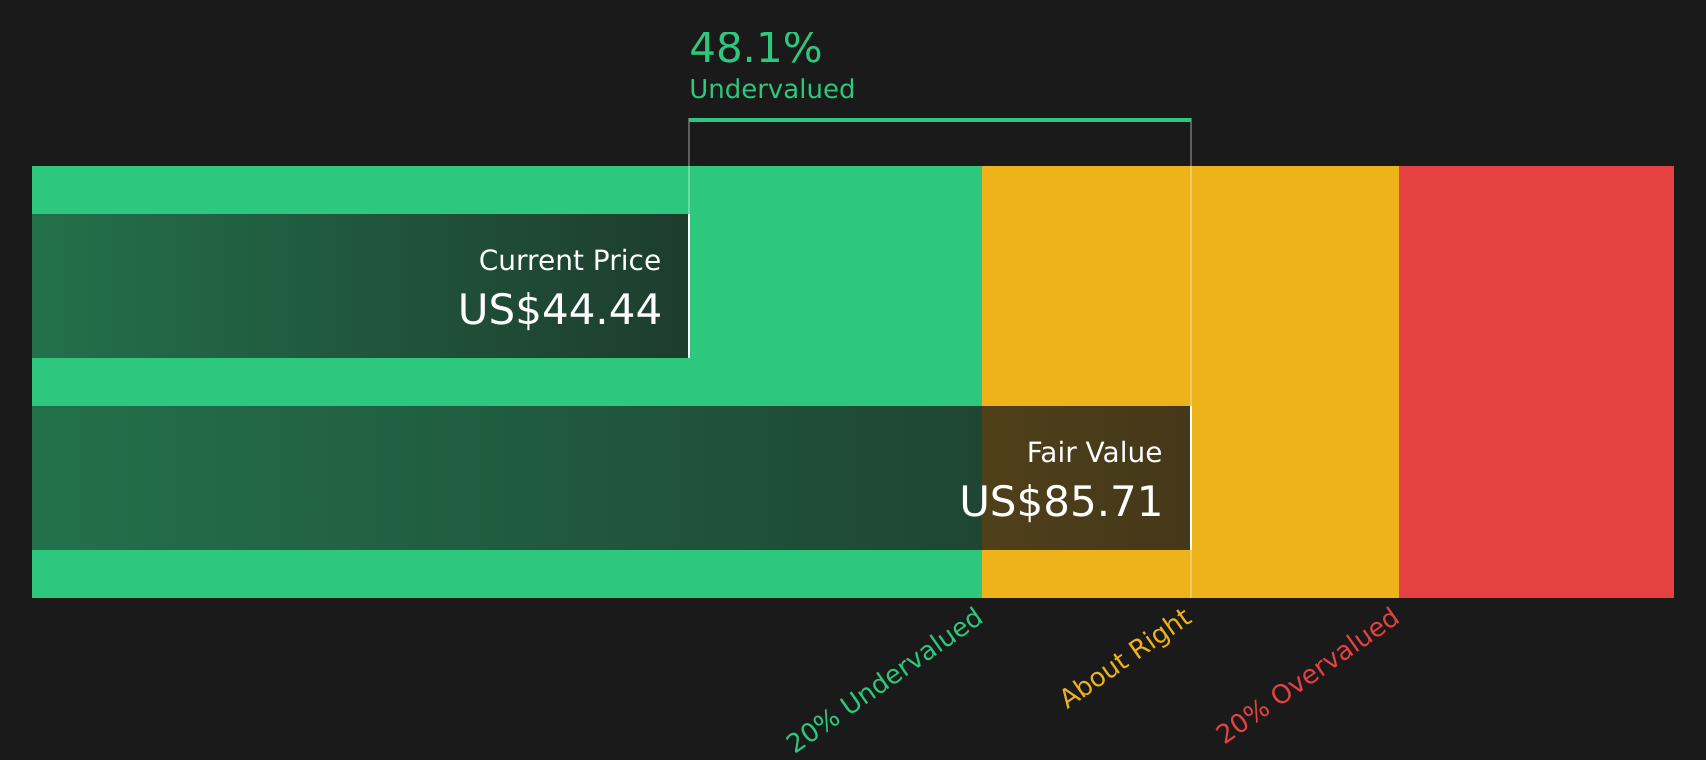
Adding these discounted cash flows gives an estimated intrinsic value of about $85.70 per share. Compared with the recent share price of $45.37, the DCF output indicates the stock trades at roughly a 47.1% discount to this estimate. On this model alone, Ternium appears to be trading below the estimated intrinsic value.
Result: UNDERVALUED
Our Discounted Cash Flow (DCF) analysis suggests Ternium is undervalued by 47.1%. Track this in your watchlist or portfolio, or discover 43 more high quality undervalued stocks.
Approach 2: Ternium Price vs Earnings
For a profitable company like Ternium, the P/E ratio is a useful gauge because it links what you pay for the stock directly to the earnings it generates. In simple terms, a higher P/E usually reflects higher growth expectations or a perception of lower risk, while a lower P/E can signal more muted growth expectations or higher perceived risk.
Ternium currently trades on a P/E of 15.59x. This sits below the Metals and Mining industry average P/E of 19.38x and also below the peer group average of 28.51x. On the surface, that suggests the stock is priced more conservatively than many industry peers.
Simply Wall St’s Fair Ratio framework goes a step further. It estimates what a “normal” P/E for Ternium might be, given factors such as earnings growth characteristics, profit margins, risks, industry and market cap. This proprietary Fair Ratio for Ternium is 23.71x, which is higher than the current 15.59x P/E. On this basis, the stock is trading below the P/E that might be implied by those fundamentals.
Result: UNDERVALUED

P/E ratios tell one story, but what if the real opportunity lies elsewhere? Start investing in legacies, not executives. Discover our 20 top founder-led companies.
Upgrade Your Decision Making: Choose your Ternium Narrative
Earlier the article mentioned that there is an even better way to understand valuation. Narratives on Simply Wall St let you attach your own story about Ternium to the numbers by tying a view on its future revenue, earnings and margins to a clear forecast and a Fair Value. You can then compare this with the current share price to decide whether the stock looks cheap or expensive. These Narratives live on the Community page, update automatically when fresh news or results arrive, and span very different viewpoints. For example, one investor sees Ternium as worth around US$62.00 based on higher revenue growth, wider margins and a lower future P/E. Another sees Fair Value closer to US$40.00 on more modest growth, lower margins and a higher discount rate.
For Ternium, however, we will make it really easy for you with previews of two leading Ternium Narratives:
Fair value: US$62.00 per share
Gap between price and this fair value: Ternium trades about 26.8% below this narrative fair value based on the recent US$45.37 share price
Assumed revenue growth: 8.77% per year
- Thesis centers on Ternium gaining share as North American supply chains regionalize and demand grows in Mexico and wider Latin America.
- Analysts in this camp model higher margins over time, helped by low emission steel capabilities and a shift toward higher value products.
- Key risks include heavy investment needs for decarbonization, steel overcapacity, Latin American macro volatility and execution on large projects.
Fair value: US$40.00 per share
Gap between price and this fair value: Ternium trades about 13.4% above this narrative fair value based on the recent US$45.37 share price
Assumed revenue growth: 3.57% per year
- Thesis highlights pressure from tighter regulation, decarbonization costs and global overcapacity that could limit steel pricing and margins.
- More conservative revenue and earnings paths reflect reliance on Latin American economies and the impact of project delays and higher capex.
- Supportive factors such as nearshoring to Mexico, cost efficiency work and a net cash balance sheet are acknowledged but seen as already reflected in the price.
These contrasting Ternium narratives give you a structured way to test your own expectations against clearly laid out assumptions, so you can decide which story, if either, is closer to how you see the company.
Do you think there's more to the story for Ternium? Head over to our Community to see what others are saying!

This article by Simply Wall St is general in nature. We provide commentary based on historical data and analyst forecasts only using an unbiased methodology and our articles are not intended to be financial advice. It does not constitute a recommendation to buy or sell any stock, and does not take account of your objectives, or your financial situation. We aim to bring you long-term focused analysis driven by fundamental data. Note that our analysis may not factor in the latest price-sensitive company announcements or qualitative material. Simply Wall St has no position in any stocks mentioned.
Have feedback on this article? Concerned about the content? Get in touch with us directly. Alternatively, email editorial-team@simplywallst.com