
- PRICING
- LIVE QUOTES
- LEARN
- HELP


EN
Assessing CNO Financial Group (CNO) Valuation After Recent Share Price Momentum
Recent performance context
CNO Financial Group (CNO) has drawn investor attention after recent trading, with the stock last closing at $47.91 and showing gains over the past week, month, and past 3 months.
See our latest analysis for CNO Financial Group.
That recent 1-day share price return of 1.68% sits within a broader trend, with a 90-day share price return of 15.33% and a 1-year total shareholder return of 26.21%, suggesting momentum has been building over time.
If CNO's recent move has you looking wider, this could be a useful moment to broaden your watchlist with 21 top founder-led companies
With CNO trading at $47.91, sitting close to analyst targets and with an estimated 28% intrinsic discount, the key question is whether this insurance stock is still undervalued or if the market is already pricing in future growth.
Most Popular Narrative: 70% Undervalued
The most followed narrative values CNO Financial Group at $48.25 per share using a 7.68% discount rate, which sits close to the recent $47.91 close yet frames the stock as materially below its longer term fair value path.
Accelerating growth in annuity and life/health policy sales, particularly driven by a rapidly aging U.S. population (11,000 Americans turning 65 each day) and increased focus on retirement income solutions, is expanding CNO's addressable market and supporting consistent, repeatable revenue gains.
Curious what sits behind that valuation gap? This narrative leans heavily on earnings expansion, margin rebuild and a future profit multiple that looks more conservative than current pricing. The real interest is how those ingredients combine to support that long term fair value path.
Result: Fair Value of $48.25 (UNDERVALUED)
Have a read of the narrative in full and understand what's behind the forecasts.
However, this story can change quickly if interest rates compress investment income or long term care claims move back toward pre pandemic patterns and pressure margins.
Find out about the key risks to this CNO Financial Group narrative.
Another View on CNO's Valuation
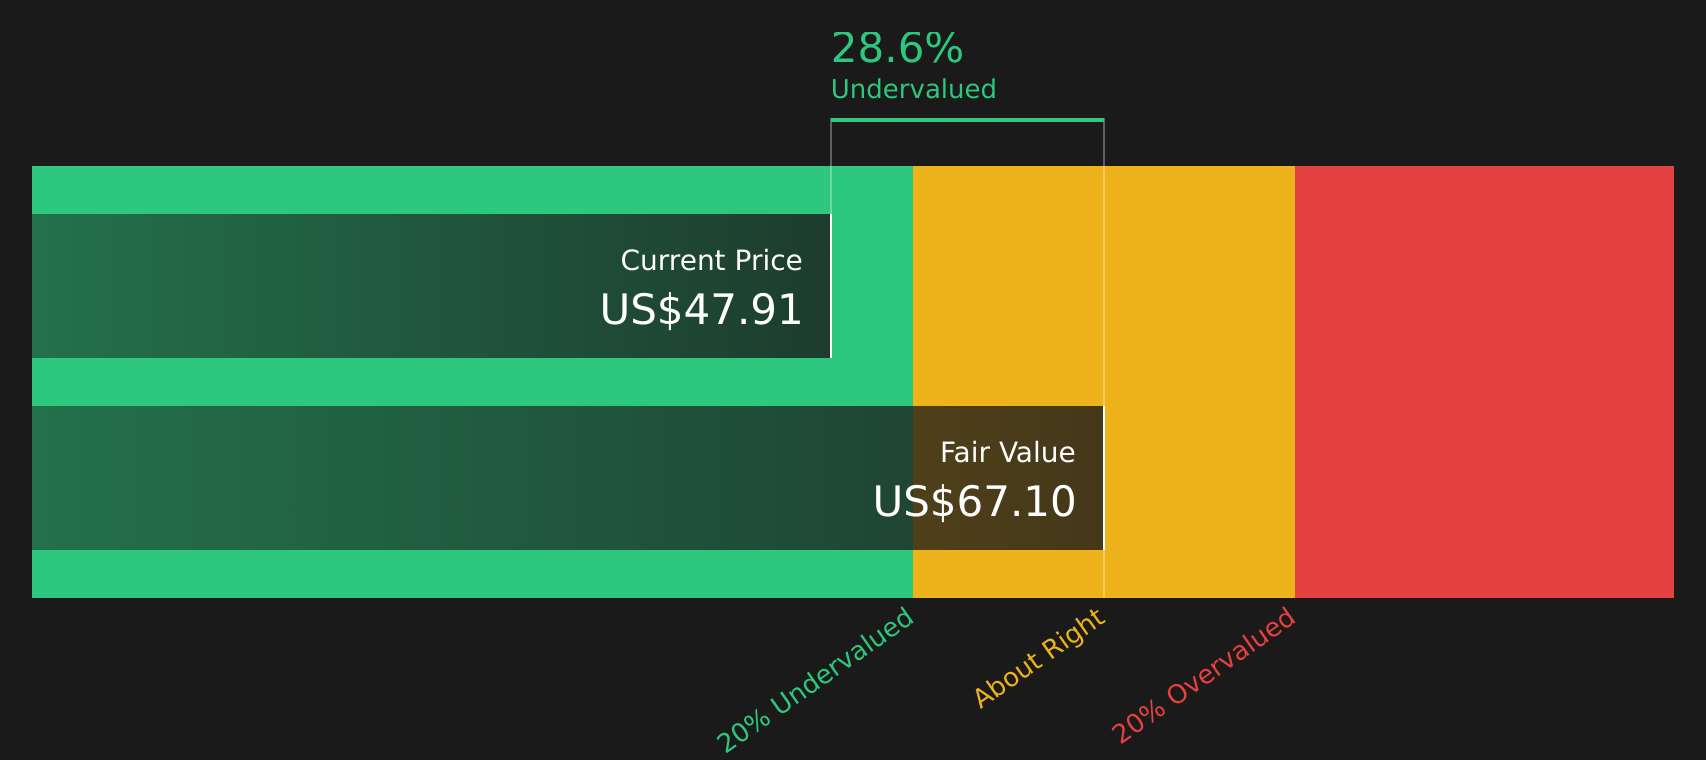
The SWS DCF model points to a fair value of $66.59 per share, with CNO trading at $47.91, which implies the stock is below that cash flow based estimate and contrasts with the tighter analyst target range around $48.25. Which view do you think better fits your own assumptions on CNO?
Look into how the SWS DCF model arrives at its fair value.
Next Steps
If this mix of optimism and concern around CNO feels familiar, use it as a prompt to check the data yourself and decide what really matters for your portfolio. Then weigh both sides of the story with 3 key rewards and 2 important warning signs
Looking for more investment ideas?
If CNO is already on your radar, now is the moment to widen your opportunity set before the next wave of ideas gets crowded.
- Spot potential growth stories early by reviewing 24 elite penny stocks with strong financials that already show stronger financial footing than many peers.
- Prioritize quality at a reasonable entry point by scanning 49 high quality undervalued stocks that combine solid fundamentals with pricing that still looks reasonable.
- Sleep a little easier at night by focusing on 64 resilient stocks with low risk scores that score well on resilience and financial strength.
This article by Simply Wall St is general in nature. We provide commentary based on historical data and analyst forecasts only using an unbiased methodology and our articles are not intended to be financial advice. It does not constitute a recommendation to buy or sell any stock, and does not take account of your objectives, or your financial situation. We aim to bring you long-term focused analysis driven by fundamental data. Note that our analysis may not factor in the latest price-sensitive company announcements or qualitative material. Simply Wall St has no position in any stocks mentioned.
Have feedback on this article? Concerned about the content? Get in touch with us directly. Alternatively, email editorial-team@simplywallst.com