
- PRICING
- LIVE QUOTES
- LEARN
- HELP


EN
RLX Technology (RLX) Valuation Check After Strong Q1 2026 Earnings And Mixed Share Price Performance
RLX Technology Q1 earnings spark fresh look at the stock
RLX Technology (RLX) released first quarter 2026 results, reporting sales of CN¥1,585.82 million and net income of CN¥284.14 million, along with higher basic and diluted earnings per share from continuing operations.
See our latest analysis for RLX Technology.
Despite the stronger first quarter figures, RLX Technology’s share price has eased. The 1 month share price return is down 9.38% and the year to date share price return is down 12.5%, while the 1 year total shareholder return is 6.78% and the 3 year total shareholder return is 19%. This points to longer term holders still being ahead even as recent momentum has softened.
If this earnings move has you rethinking where growth could come from next, it may be worth widening your search to other opportunities in AI infrastructure through 47 AI infrastructure stocks
With earnings per share higher, annual growth in revenue and profit, a US$2.03 share price and a sizeable gap to analyst targets, you have to ask if RLX is undervalued or if markets already price in future growth.
Most Popular Narrative: 35.3% Undervalued
Analysts following RLX see a fair value of about $3.14 versus the latest $2.03 close, which puts their narrative well ahead of where the market is currently pricing the stock.
The ongoing global shift from traditional cigarettes to reduced-risk products, such as e-vapor and oral nicotine, is growing the overall nicotine alternatives market. RLX's leadership and early move into multi-category offerings position it to capture expanding consumer demand, supporting strong long-term revenue growth.
Want to see what sits behind that growth story? The narrative rests on rising revenue, changing margins and a future earnings multiple that assumes real execution. Curious which assumptions matter most.
Result: Fair Value of $3.14 (UNDERVALUED)
Have a read of the narrative in full and understand what's behind the forecasts.
However, this hinges on regulators and competitors. Tighter e vapor rules or tougher global competition are both capable of quickly challenging the current upside story.
Find out about the key risks to this RLX Technology narrative.
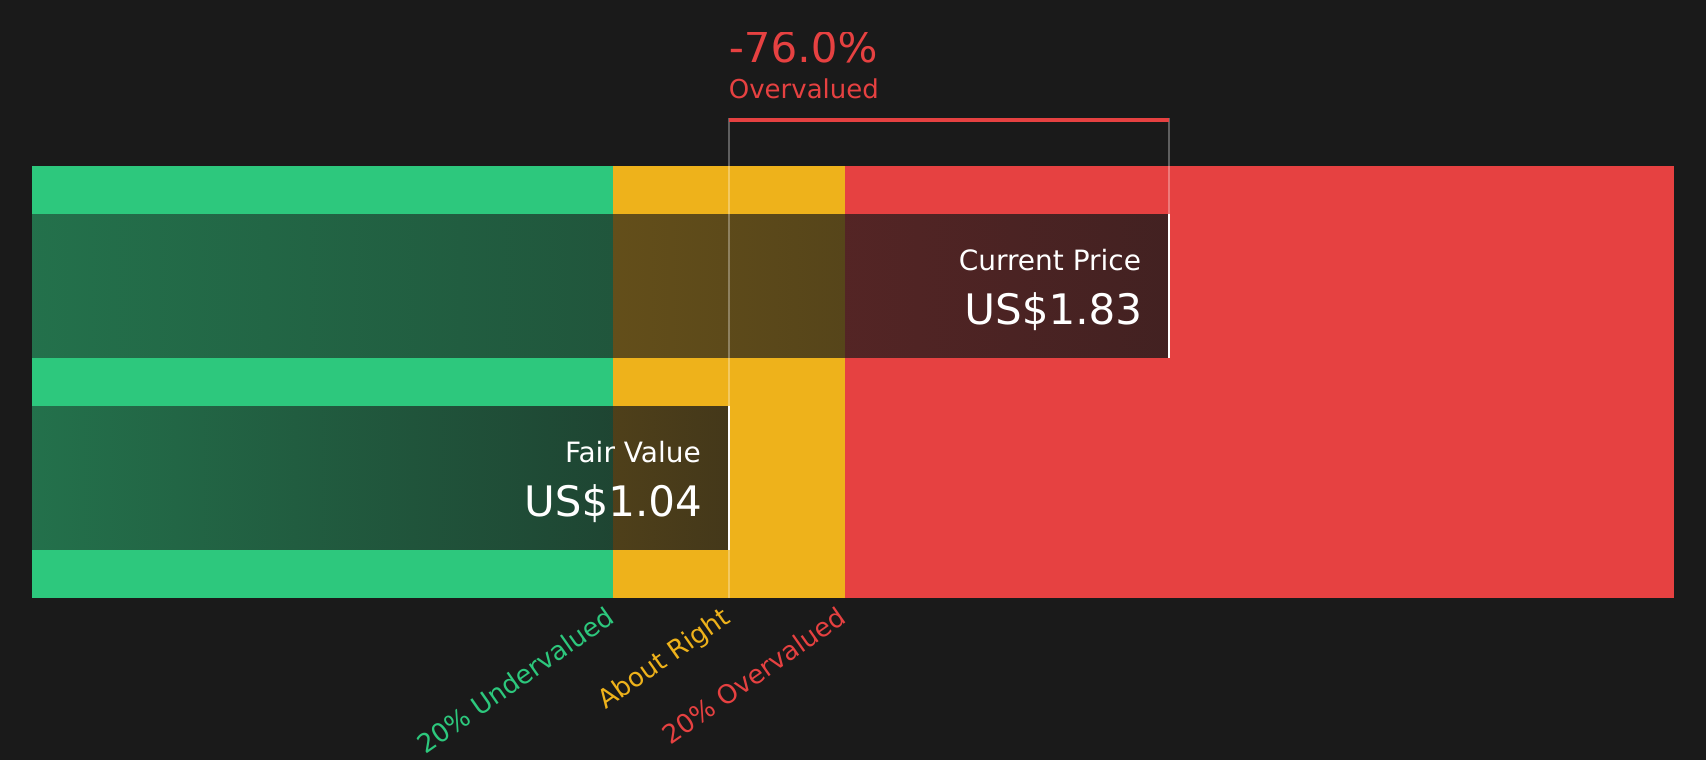
Another View: DCF Paints a Tougher Picture
The analyst narrative points to a fair value of about $3.14 and labels RLX as 35.3% undervalued, but our DCF model tells a different story. On that measure, the stock at $2.03 trades above an estimated future cash flow value of $1.03, which implies overvaluation instead.
That gap between earnings based valuation upside and cash flow based caution leaves you with a simple question: which story do you trust more when putting real money at risk?
Look into how the SWS DCF model arrives at its fair value.
Simply Wall St performs a discounted cash flow (DCF) on every stock in the world every day (check out RLX Technology for example). We show the entire calculation in full. You can track the result in your watchlist or portfolio and be alerted when this changes, or use our stock screener to discover 46 high quality undervalued stocks. If you save a screener we even alert you when new companies match - so you never miss a potential opportunity.
Next Steps
With sentiment clearly split between upside potential and caution, this is a moment to move fast, review the data yourself and weigh both sides, including the 4 key rewards and 1 important warning sign.
Looking for more investment ideas?
Do not stop with a single stock. Broaden your watchlist with fresh ideas that match your goals using focused screeners designed to surface specific types of opportunities.
- Target potential mispricings by running through 46 high quality undervalued stocks to filter for companies combining quality metrics with attractive prices.
- Prioritise resilience by checking solid balance sheet and fundamentals stocks screener (46 results) to highlight businesses with stronger financial footing and cleaner balance sheets.
- Get ahead of the crowd by scanning screener containing 22 high quality undiscovered gems to spotlight under-the-radar companies with strong fundamentals before attention catches up.
This article by Simply Wall St is general in nature. We provide commentary based on historical data and analyst forecasts only using an unbiased methodology and our articles are not intended to be financial advice. It does not constitute a recommendation to buy or sell any stock, and does not take account of your objectives, or your financial situation. We aim to bring you long-term focused analysis driven by fundamental data. Note that our analysis may not factor in the latest price-sensitive company announcements or qualitative material. Simply Wall St has no position in any stocks mentioned.
Have feedback on this article? Concerned about the content? Get in touch with us directly. Alternatively, email editorial-team@simplywallst.com