
- PRICING
- LIVE QUOTES
- LEARN
- HELP


EN
Assessing P10 (PX) Valuation After Recent Share Price Momentum And Premium P/E Multiple
What is moving P10 right now?
P10 (PX) has drawn fresh investor interest after a period of mixed recent returns, with a gain over the past month but a slight decline across the past 3 months.
See our latest analysis for P10.
With the share price at $10.44, P10 has a 1 day share price return of 2.86% and a 30 day share price return of 3.78%. Its 1 year total shareholder return of a 20.69% decline points to short term momentum building after a weaker longer term experience.
If you are looking beyond a single name in alternatives, it could be a useful moment to broaden your watchlist with fast growing stocks with high insider ownership.
With P10 trading at $10.44 against an analyst target of $15.88 and an indicated intrinsic premium, the key question is whether the current discount reflects mispricing or whether the market is already crediting future growth.
Price-to-Earnings of 74.9x: Is it justified?
On a P/E of 74.9x against a last close of $10.44, P10 screens as expensive compared with both its peers and the wider US Capital Markets industry.
The P/E ratio compares the current share price with earnings per share, so a higher multiple usually reflects investors paying more today for each unit of current earnings.
For P10, a 74.9x P/E alongside a low current Return on Equity of 4.4% suggests the market is assigning a rich price to relatively modest profitability. That sits alongside a Simply Wall St DCF estimate of fair value at $0.51, which points to the share price trading above that model’s implied worth.
Compared with its direct peer group average P/E of 8.7x and the US Capital Markets industry average of 25.6x, P10 trades on a much higher multiple, which is a clear premium to both peers and the broader sector.
See what the numbers say about this price — find out in our valuation breakdown.
Result: Price-to-Earnings of 74.9x (OVERVALUED)
However, the rich P/E, together with a Simply Wall St DCF value of $0.51 and modest $15.33 net income, could leave the shares vulnerable if sentiment cools.
Find out about the key risks to this P10 narrative.
Another View: What Does The DCF Say?
While the 74.9x P/E makes P10 look expensive, our DCF model also points to the shares trading above its estimate of fair value at $0.51 versus the current $10.44. When both earnings and cash flow based views flag a premium, it raises a simple question: what might the market be pricing in that these models do not?
Look into how the SWS DCF model arrives at its fair value.
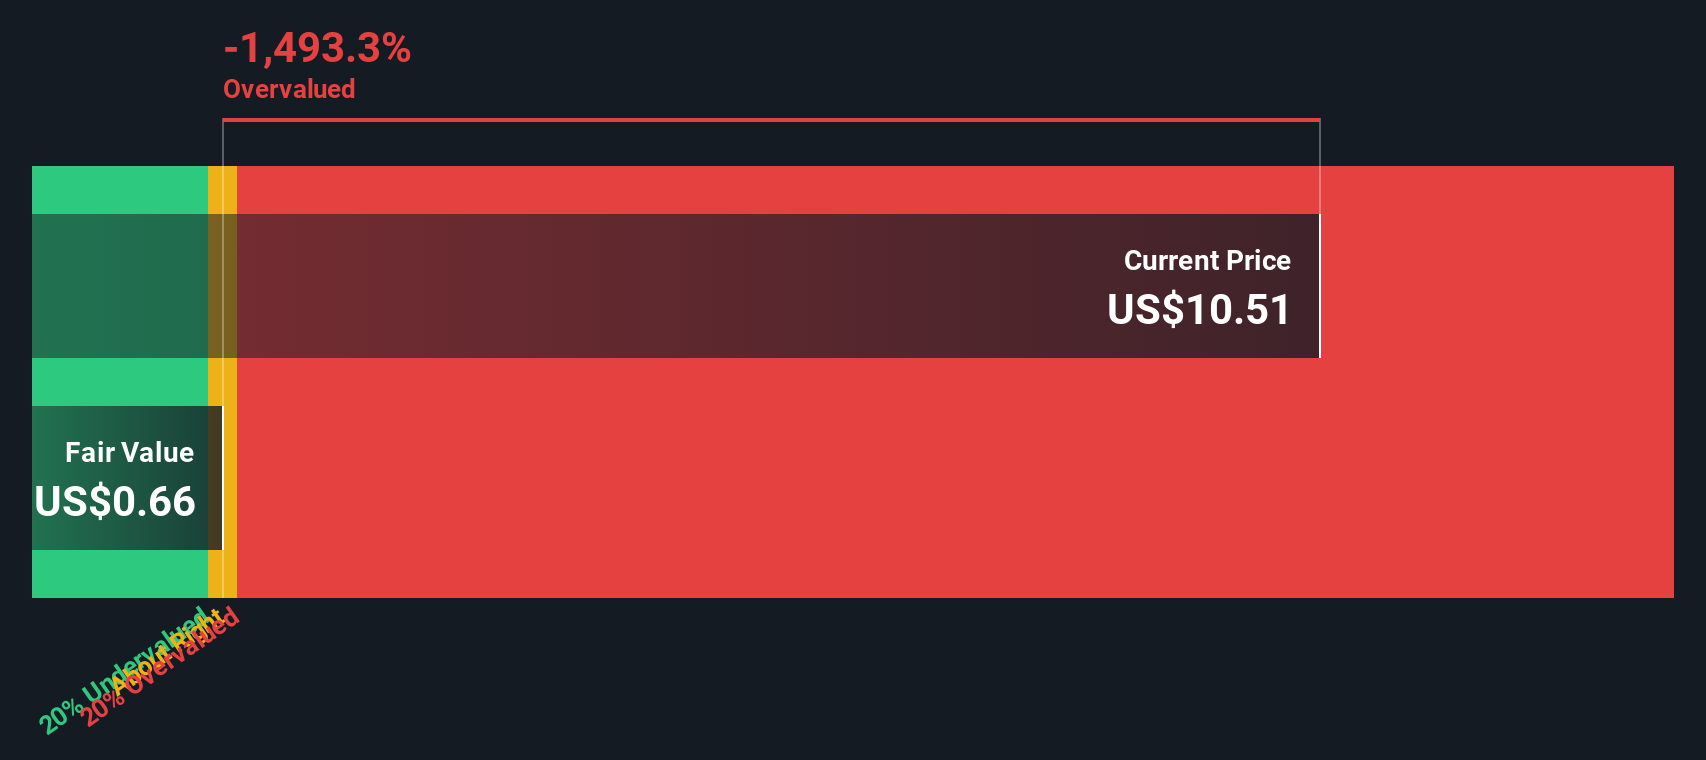
Simply Wall St performs a discounted cash flow (DCF) on every stock in the world every day (check out P10 for example). We show the entire calculation in full. You can track the result in your watchlist or portfolio and be alerted when this changes, or use our stock screener to discover 886 undervalued stocks based on their cash flows. If you save a screener we even alert you when new companies match - so you never miss a potential opportunity.
Build Your Own P10 Narrative
If you look at the numbers and reach a different conclusion, or simply want to run your own checks, you can build a custom view in just a few minutes with Do it your way.
A great starting point for your P10 research is our analysis highlighting 2 key rewards and 4 important warning signs that could impact your investment decision.
Looking for more investment ideas?
If P10 has caught your eye, do not stop there, the best opportunities often show up when you compare a few different angles side by side.
- Hunt for potential value by checking out these 886 undervalued stocks based on cash flows that line up current prices with underlying cash flows.
- Target income focused opportunities by scanning these 12 dividend stocks with yields > 3% that may suit a yield anchored approach.
- Ride new themes in digital assets by reviewing these 80 cryptocurrency and blockchain stocks tied to blockchain, payments, and related infrastructure.
This article by Simply Wall St is general in nature. We provide commentary based on historical data and analyst forecasts only using an unbiased methodology and our articles are not intended to be financial advice. It does not constitute a recommendation to buy or sell any stock, and does not take account of your objectives, or your financial situation. We aim to bring you long-term focused analysis driven by fundamental data. Note that our analysis may not factor in the latest price-sensitive company announcements or qualitative material. Simply Wall St has no position in any stocks mentioned.
Have feedback on this article? Concerned about the content? Get in touch with us directly. Alternatively, email editorial-team@simplywallst.com