
- PRICING
- LIVE QUOTES
- LEARN
- HELP


EN
Is It Too Late To Consider HOYA (TSE:7741) After Its Strong 1 Year Surge?
- Wondering whether HOYA's share price still reflects good value after a strong run, or if most of the easy gains are already behind it? This article breaks down what the current price may be implying.
- HOYA's stock closed at ¥27,080, with returns of 3.3% over 7 days, a decline of 6.9% over 30 days, 12.3% year to date, 60.2% over 1 year, 54.7% over 3 years and 102.1% over 5 years. This raises questions about how the current valuation lines up with those moves.
- Recent coverage has focused on how HOYA fits within broader healthcare and technology themes, as investors reassess companies linked to medical equipment, optics and data related products. This backdrop helps explain why the stock's strong 1 year and 5 year returns are now being weighed more carefully against valuation.
- On Simply Wall St's 6 point valuation checklist HOYA scores 0 out of 6. The next sections will walk through traditional methods like P/E and discounted cash flow, then finish with a broader way to think about what "fair value" might really mean for this stock.
HOYA scores just 0/6 on our valuation checks. See what other red flags we found in the full valuation breakdown.
Approach 1: HOYA Discounted Cash Flow (DCF) Analysis
A Discounted Cash Flow, or DCF, model estimates what a stock might be worth by projecting future cash flows and discounting them back to today at an appropriate rate. It aims to answer a simple question: what are those future ¥ cash flows worth in today’s terms?
For HOYA, the model uses last twelve month Free Cash Flow of ¥224,894.17m and a 2 Stage Free Cash Flow to Equity approach. Analyst estimates and extrapolations produce ten year projections, with projected Free Cash Flow of ¥395,713.65m by 2035. Simply Wall St uses analyst inputs up to 2030, then extends the series using its own growth assumptions for later years.
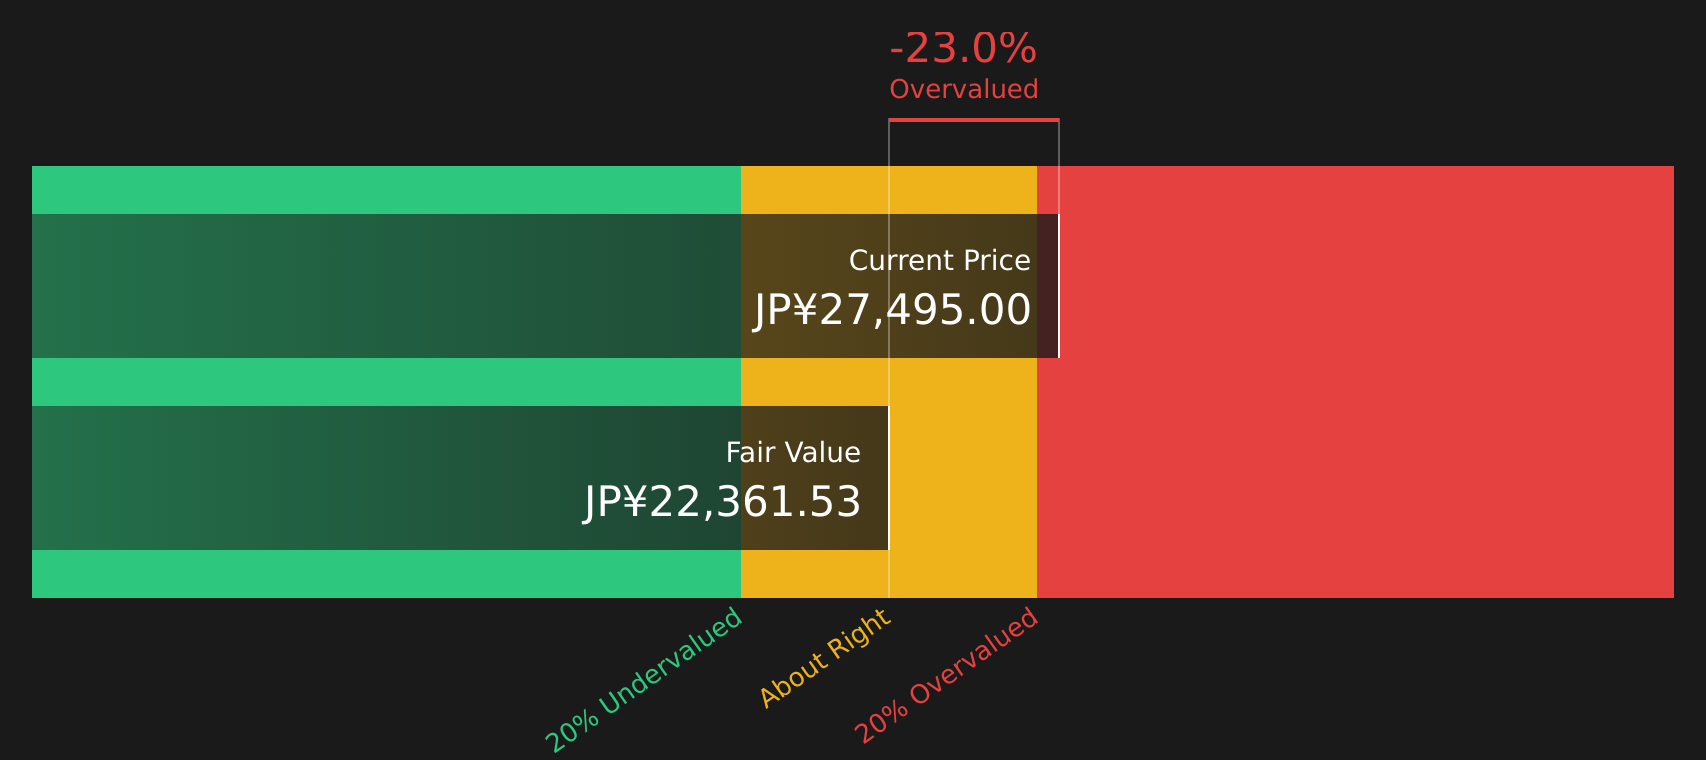
When all those projected cash flows are discounted back, the estimated intrinsic value comes out at ¥22,242.91 per share. Compared with the current share price of ¥27,080, the DCF output indicates the stock is trading about 21.7% above this estimate. This suggests the market is placing a higher value on HOYA than this particular cash flow model supports.
Result: OVERVALUED
Our Discounted Cash Flow (DCF) analysis suggests HOYA may be overvalued by 21.7%. Discover 16 high quality undervalued stocks or create your own screener to find better value opportunities.
Approach 2: HOYA Price vs Earnings
For profitable companies like HOYA, the P/E ratio is a straightforward way to link what you pay for each share with the earnings the business is currently generating. It helps you see how many years of current earnings the market is effectively pricing into the stock.
What counts as a “normal” P/E will vary. Higher expected earnings growth or lower perceived risk can justify a higher multiple, while slower growth or higher risk usually point to a lower one. HOYA trades on a P/E of 35.83x, compared with the Medical Equipment industry average of 14.35x and a peer group average of 26.14x, so the stock sits well above these simple benchmarks.
Simply Wall St’s Fair Ratio concept goes a step further. It estimates what a “fair” P/E might be by looking at factors such as earnings growth, profit margins, industry, market cap and risk profile. For HOYA, this Fair Ratio is 28.37x, which is lower than the current 35.83x P/E. That gap suggests the stock is pricing in more optimistic conditions than the Fair Ratio implies.
Result: OVERVALUED

P/E ratios tell one story, but what if the real opportunity lies elsewhere? Start investing in legacies, not executives. Discover our 13 top founder-led companies.
Upgrade Your Decision Making: Choose your HOYA Narrative
Earlier we mentioned that there is an even better way to understand valuation, so Narratives are Simply Wall St’s way of letting you attach a clear story to your numbers by linking your view on HOYA’s future revenue, earnings and margins to a forecast and then to your own fair value estimate.
A Narrative is straightforward. You set your assumptions. The platform used by millions of investors on the Community page turns that into a financial forecast. You can then immediately see how your Fair Value compares with the current share price to help decide whether HOYA looks attractive, fairly priced or expensive for you.
Importantly, Narratives are not static. They update when new information such as news, guidance or earnings is added. This helps your story, forecast and Fair Value stay aligned with what is happening around the company.
For HOYA, one investor might build a Narrative that supports a relatively high fair value. Another investor, using more conservative revenue growth and margin assumptions, could arrive at a much lower figure. This shows how the same stock can look very different depending on the story and numbers you choose.
Do you think there's more to the story for HOYA? Head over to our Community to see what others are saying!

This article by Simply Wall St is general in nature. We provide commentary based on historical data and analyst forecasts only using an unbiased methodology and our articles are not intended to be financial advice. It does not constitute a recommendation to buy or sell any stock, and does not take account of your objectives, or your financial situation. We aim to bring you long-term focused analysis driven by fundamental data. Note that our analysis may not factor in the latest price-sensitive company announcements or qualitative material. Simply Wall St has no position in any stocks mentioned.
Have feedback on this article? Concerned about the content? Get in touch with us directly. Alternatively, email editorial-team@simplywallst.com