
- PRICING
- LIVE QUOTES
- LEARN
- HELP


EN
A Look At StoneX Group (SNEX) Valuation After Birmingham Expansion And Hiring Plans
StoneX Group (SNEX) is expanding its Birmingham, Alabama operations with a new 46,000 square foot office and plans to add nearly 90 employees over three to five years. This move reinforces the city’s role in its global platform.
See our latest analysis for StoneX Group.
Recent announcements, including the Birmingham expansion and a new quantum computing summit hosted by subsidiary The Benchmark Company, come as StoneX’s 90 day share price return of 31.29% and 1 year total shareholder return of 91.72% point to strong momentum across both shorter and longer horizons.
If this kind of momentum has you looking beyond a single stock, it may be an appropriate time to broaden your search and check out 20 top founder-led companies
With SNEX trading at US$112.12, currently about 10% below one analyst price target and slightly above one intrinsic value estimate, the key question is whether there is still an opportunity here or if the market is already fully reflecting its prospects.
Price-to-Earnings of 19.9x: Is it justified?
On a P/E of 19.9x, StoneX Group trades at a richer level than its direct peers on 12.6x, even though it sits well below the broader US Capital Markets industry on 40.1x.
The P/E multiple compares the current share price to earnings per share and is a quick way of seeing how much investors are paying for each dollar of profit. For a financial services network like StoneX, that figure often reflects expectations around the durability of earnings and the stability of its business mix across Commercial, Institutional, Retail and Payments segments.
Here, the market is assigning StoneX a premium to its peer group. This can suggest firmer confidence in its earnings profile and 5 year track record of profit growth. However, the stock also screens as expensive versus an estimated fair P/E of 15.1x. If the market were to move closer to that fair multiple, it would imply a lower valuation than today. By contrast, staying near the broader Capital Markets average would point to a much higher relative rating.
Compared with the wider US Capital Markets industry, StoneX’s 19.9x P/E looks restrained against 40.1x. Even so, the gap to the 12.6x peer average and the 15.1x fair ratio highlights how much of a premium is already embedded.
Explore the SWS fair ratio for StoneX Group
Result: Price-to-Earnings of 19.9x (ABOUT RIGHT)
However, sustained share price gains could face pressure if earnings stumble or if sentiment shifts regarding the stock’s current premium to peers and fair value estimates.
Find out about the key risks to this StoneX Group narrative.
Another View: Cash Flows Tell a Tougher Story
While the P/E of 19.9x suggests SNEX sits somewhere between peers and the wider industry, our DCF model points the other way. It indicates an estimated future cash flow value of about $31.31 versus the current $112.12 share price. That gap signals clear overvaluation on this method, so which signal do you trust more?
Look into how the SWS DCF model arrives at its fair value.
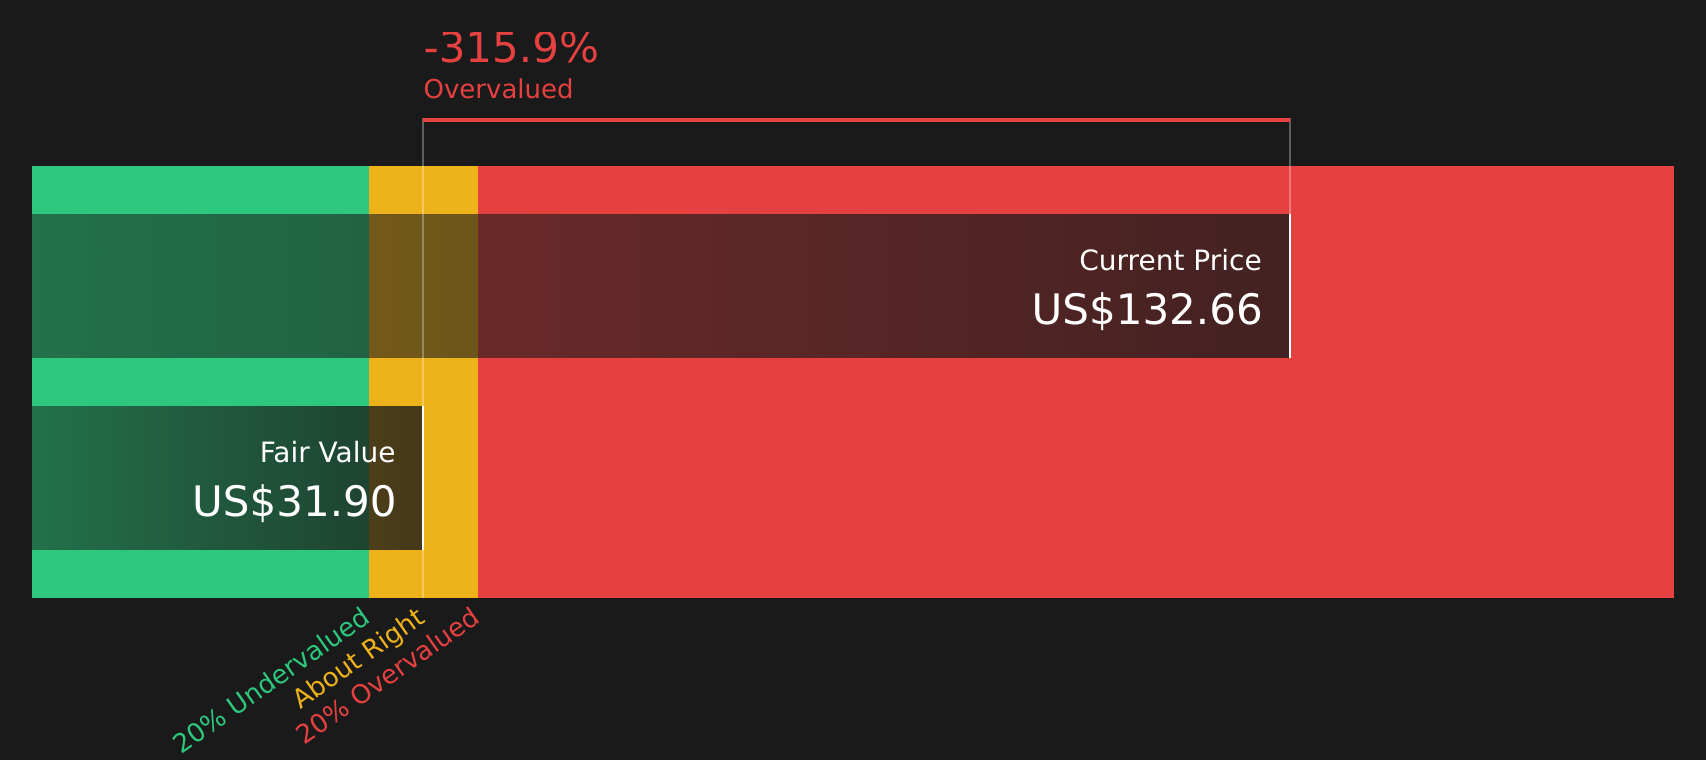
Simply Wall St performs a discounted cash flow (DCF) on every stock in the world every day (check out StoneX Group for example). We show the entire calculation in full. You can track the result in your watchlist or portfolio and be alerted when this changes, or use our stock screener to discover 48 high quality undervalued stocks. If you save a screener we even alert you when new companies match - so you never miss a potential opportunity.
Next Steps
Mixed signals on valuation can feel confusing, so it helps to look at the underlying data yourself and decide how comfortable you are with both the upside and the risks. To get a clearer picture of what the market is weighing on both sides, take a moment to review the 3 key rewards and 1 important warning sign
Looking for more investment ideas?
If you are serious about building a stronger portfolio, do not stop with a single stock story. Use data driven tools to spot your next opportunity.
- Target income potential by reviewing income focused stocks screened as 10 dividend fortresses that may appeal if regular payouts matter to you.
- Strengthen your capital protection by checking companies in the 65 resilient stocks with low risk scores that score well on lower risk indicators.
- Get ahead of the crowd by scanning the screener containing 21 high quality undiscovered gems that combine solid fundamentals with less market attention.
This article by Simply Wall St is general in nature. We provide commentary based on historical data and analyst forecasts only using an unbiased methodology and our articles are not intended to be financial advice. It does not constitute a recommendation to buy or sell any stock, and does not take account of your objectives, or your financial situation. We aim to bring you long-term focused analysis driven by fundamental data. Note that our analysis may not factor in the latest price-sensitive company announcements or qualitative material. Simply Wall St has no position in any stocks mentioned.
Have feedback on this article? Concerned about the content? Get in touch with us directly. Alternatively, email editorial-team@simplywallst.com