
- PRICING
- LIVE QUOTES
- LEARN
- HELP


EN
Is It Too Late To Consider Bombardier (TSX:BBD.B) After Its 230% One-Year Surge
- Wondering whether Bombardier's recent share price action still leaves room for value, or if the stock has already done its best work.
- The stock last closed at C$296.54, with returns of 13.3% over 7 days, 22.3% over 30 days, 23.2% year to date and 230.7% over 1 year, so recent performance is front of mind for many investors assessing risk and reward.
- Bombardier has been in the headlines recently regarding its position within the Aerospace & Defense sector and investor interest linked to wider industry themes, giving extra context to the strong share price moves. For anyone tracking the stock, this backdrop helps frame whether current enthusiasm reflects changing expectations or simply sentiment catching up.
- On Simply Wall St's valuation checks, Bombardier scores 5 out of 6, which you can see in detail in the valuation score. The next sections will walk through the main valuation methods used to assess the stock and will also point to a more complete way to think about value at the end of the article.
Approach 1: Bombardier Discounted Cash Flow (DCF) Analysis
A Discounted Cash Flow, or DCF, model estimates what a stock could be worth by projecting future cash flows and discounting them back to today using a required rate of return.
For Bombardier, the model used is a 2 Stage Free Cash Flow to Equity approach based on cash flow projections. The latest twelve month free cash flow is reported at $1.66b. Analyst estimates and extrapolations point to projected free cash flow of $1.60b in 2030, with interim years between 2026 and 2035 ranging from about $1.06b to $2.22b before discounting.
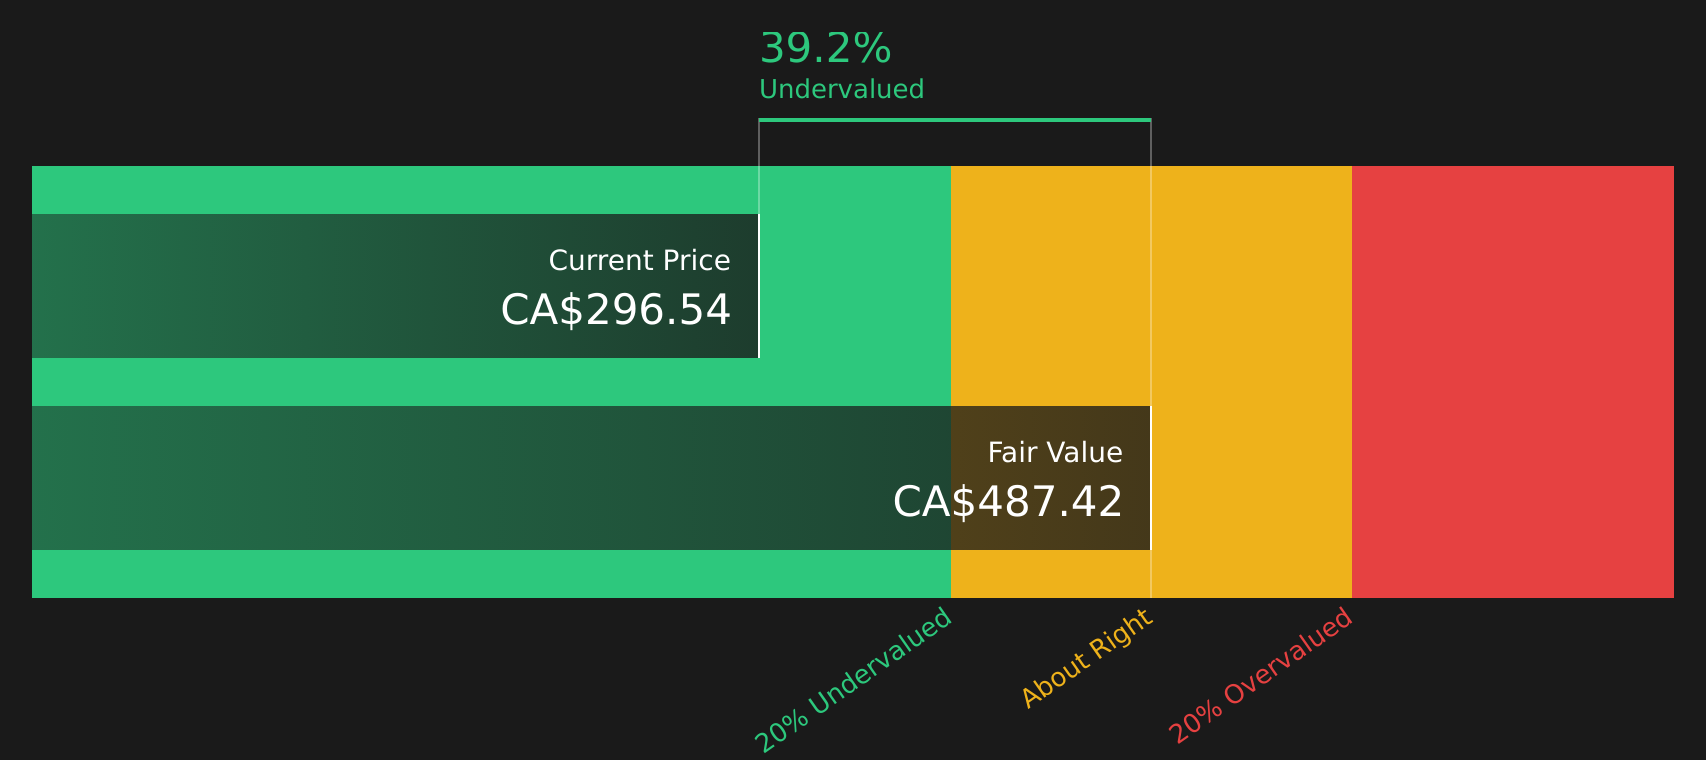
When all those projected cash flows are discounted back, Simply Wall St estimates an intrinsic value of $487.42 per share. Compared with the recent share price of CA$296.54, this DCF output indicates the stock is trading at about a 39.2% discount to that estimate, which highlights a material gap between the modelled value and the market price.
Result: UNDERVALUED
Our Discounted Cash Flow (DCF) analysis suggests Bombardier is undervalued by 39.2%. Track this in your watchlist or portfolio, or discover 9 more high quality undervalued stocks.
Approach 2: Bombardier Price vs Earnings
For profitable companies, the P/E ratio is a straightforward way to relate what you pay for each share to the earnings that support that price. It helps you see how many dollars of share price correspond to one dollar of current earnings.
What counts as a "normal" P/E depends on how the market views a company’s growth potential and risks. Higher expected growth or lower perceived risk can justify a higher P/E, while slower growth or higher risk usually lines up with a lower multiple.
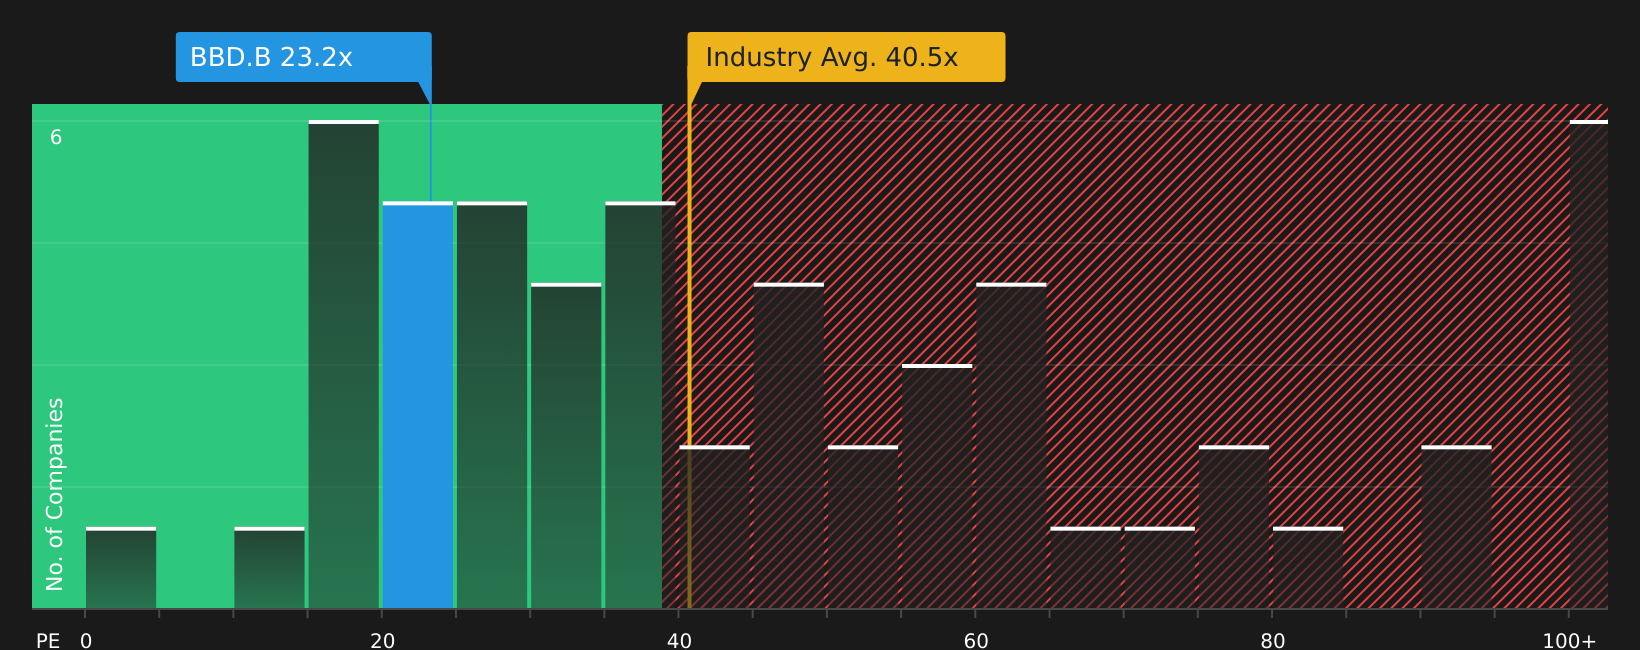
Bombardier currently trades on a P/E of 22.18x. That sits below the Aerospace & Defense industry average P/E of 49.55x and below the peer group average of 43.96x. Simply Wall St also calculates a "Fair Ratio" of 37.17x, which reflects the P/E that might be expected given Bombardier’s earnings growth profile, industry, profit margins, market cap and risk factors.
This Fair Ratio is more tailored than a simple comparison with peers or the broad industry, because it builds those company specific characteristics into the benchmark. Comparing 22.18x with the Fair Ratio of 37.17x indicates that the stock is trading below the multiple implied by these fundamentals.
Result: UNDERVALUED
P/E ratios tell one story, but what if the real opportunity lies elsewhere? Start investing in legacies, not executives. Discover our 3 top founder-led companies.
Upgrade Your Decision Making: Choose your Bombardier Narrative
Earlier it was mentioned that there is an even better way to understand valuation. Narratives take this further by letting you attach a clear story about Bombardier to the numbers you care about, including your own view of fair value and how revenue, earnings and margins might evolve. You can then link that story to a financial forecast on Simply Wall St’s Community page, where millions of investors share their work. This allows you to compare your chosen Fair Value with the current share price to decide whether Bombardier looks attractive or stretched on your assumptions. You can also see that Narratives update automatically when new news or earnings arrive, and even contrast very different views, such as a cautious Narrative that points to a Fair Value around CA$234.52 and a more optimistic Narrative closer to CA$304.33. This can help you decide which story, and which valuation, best matches how you see the company.
For Bombardier however we'll make it really easy for you with previews of two leading Bombardier Narratives:
Fair value: CA$304.33
Gap to this fair value: trading about 2.6% below the narrative fair value on the latest close.
Revenue growth assumption: 7.07% a year.
- This narrative assumes that the service and defense segments, plus large emerging market orders, support higher margin growth than current consensus assumes.
- It also builds in a continued focus on operations, balance sheet repair and product upgrades to support scaling and pricing power.
- It flags key risks around leverage, exposure to business jets, regulation and technology shifts that could challenge this optimistic path.
Fair value: CA$47.40
Gap to this fair value: trading well above the narrative fair value, implying a very large premium on the latest close.
Revenue growth assumption: 2.5% a year.
- This narrative points to a stock price that already reflects strong progress on financial discipline and focus on business jets.
- It views the current P/E as leaving limited room if earnings or efficiency gains come in below expectations.
- It raises the question of whether the recent share price momentum can be maintained without a clear next leg of growth.
Seen together, these Narratives show how different sets of assumptions can justify very different views on Bombardier. They provide clear starting points to stress test your own expectations for revenue growth, margins and valuation, rather than relying on a single headline figure.
To see how these results tie into long-term growth, risks, and valuation, check out the full range of community narratives for Bombardier on Simply Wall St. Add the company to your watchlist or portfolio so you'll be alerted when the story evolves.
Do you think there's more to the story for Bombardier? Head over to our Community to see what others are saying!

This article by Simply Wall St is general in nature. We provide commentary based on historical data and analyst forecasts only using an unbiased methodology and our articles are not intended to be financial advice. It does not constitute a recommendation to buy or sell any stock, and does not take account of your objectives, or your financial situation. We aim to bring you long-term focused analysis driven by fundamental data. Note that our analysis may not factor in the latest price-sensitive company announcements or qualitative material. Simply Wall St has no position in any stocks mentioned.
Have feedback on this article? Concerned about the content? Get in touch with us directly. Alternatively, email editorial-team@simplywallst.com