
- PRICING
- LIVE QUOTES
- LEARN
- HELP


EN
Is It Too Late To Consider NXP Semiconductors (NXPI) After A 68% One Year Surge?
- For investors wondering whether NXP Semiconductors at around US$316 a share still offers value, or if the easy gains are behind it, this article focuses on what the current price might imply.
- The stock has returned 8.6% over the past week, 40.2% over the last 30 days, 43.0% year to date, and 67.8% over the past year. These moves have drawn fresh attention from investors assessing both opportunity and risk.
- Recent coverage has highlighted NXP Semiconductors as a key player in semiconductors for areas such as automotive electronics and secure connectivity. This helps explain why the stock has been in focus. Ongoing interest in these themes keeps bringing the valuation question back to the forefront for this stock.
- NXP Semiconductors currently has a valuation score of 3/6. The next sections will break this down using different valuation methods and will also introduce an additional way to think about value at the end of the article.
Find out why NXP Semiconductors's 67.8% return over the last year is lagging behind its peers.
Approach 1: NXP Semiconductors Discounted Cash Flow (DCF) Analysis
A Discounted Cash Flow, or DCF, model looks at the cash NXP Semiconductors is expected to generate in the future and then discounts those cash flows back to today to estimate what the business might be worth in dollars.
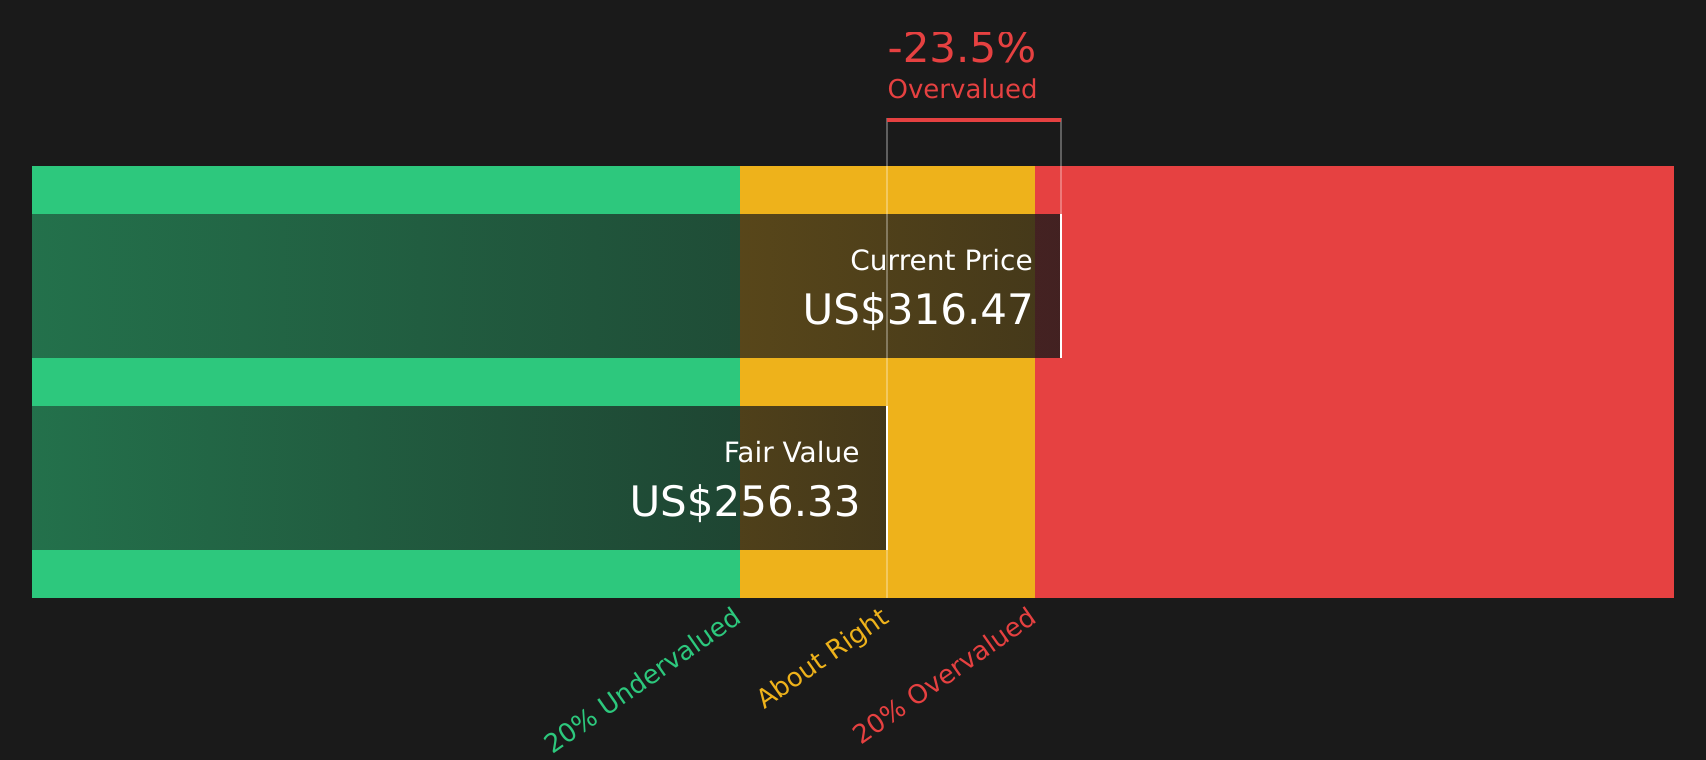
NXP Semiconductors currently reports last twelve month free cash flow of about $2.31b. The 2 Stage Free Cash Flow to Equity model here uses analyst projections for the next few years and then extends those further out. For example, projected free cash flow for 2030 is $5.50b, with intermediate years such as 2026 and 2027 at $3.70b and $3.91b respectively, all discounted back to reflect the time value of money and risk.
Pulling these discounted cash flows together gives an estimated intrinsic value of $254.88 per share. Compared with the current share price of around $316, the DCF output suggests the stock is about 24.2% above this intrinsic estimate, which indicates a premium valuation on this model.
Result: OVERVALUED
Our Discounted Cash Flow (DCF) analysis suggests NXP Semiconductors may be overvalued by 24.2%. Discover 49 high quality undervalued stocks or create your own screener to find better value opportunities.
Approach 2: NXP Semiconductors Price vs Earnings
For a profitable company, the P/E ratio is a straightforward way to connect what you pay for the stock with the earnings it is currently generating. It helps you see how many dollars investors are paying today for each dollar of recent earnings.
A higher or lower P/E often reflects what the market expects for future growth and how risky those earnings might be. Companies with stronger expected growth or lower perceived risk usually trade on higher P/E multiples, while slower growth or higher risk tends to be associated with lower P/E levels.
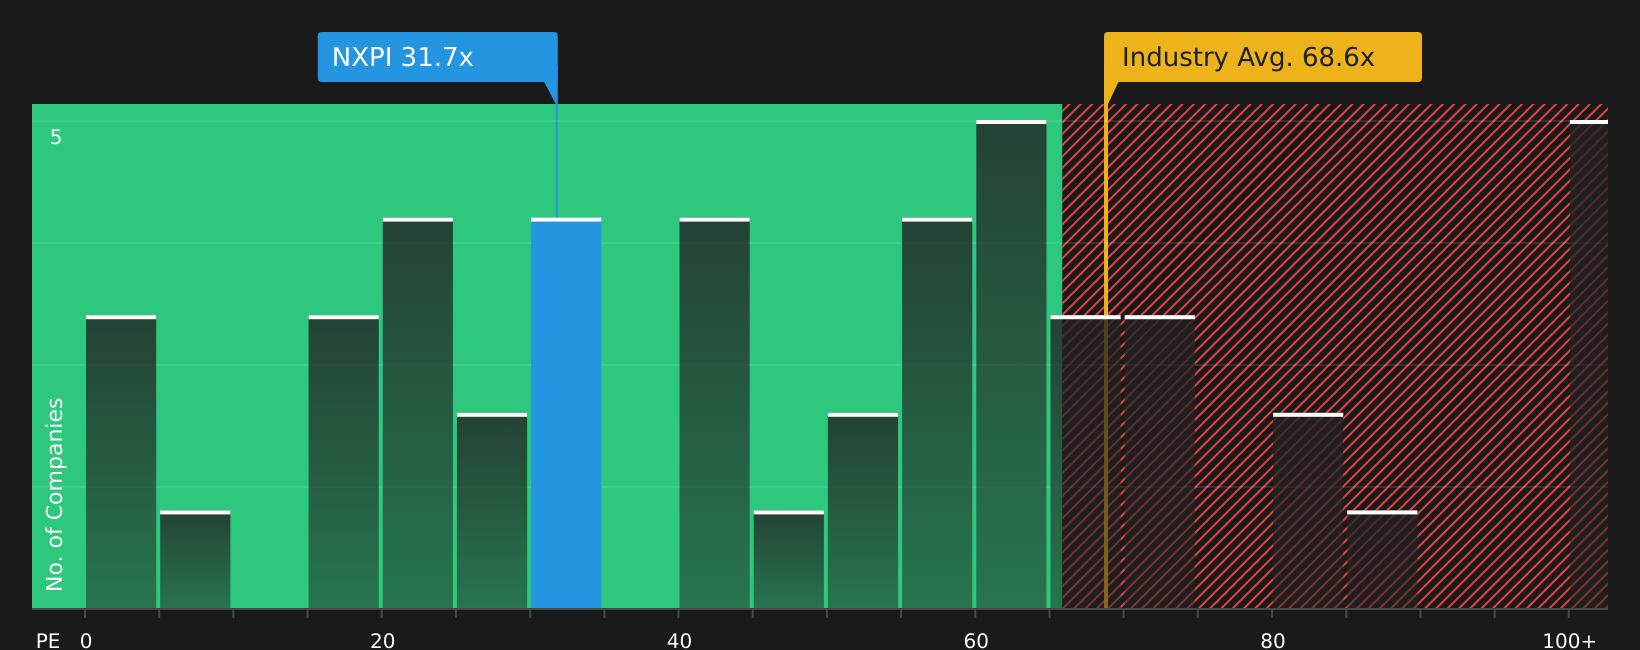
NXP Semiconductors currently trades on a P/E of about 30.1x. This sits below the Semiconductor industry average P/E of about 65.0x and also below the peer group average of about 112.8x. Simply Wall St also provides a “Fair Ratio” of 36.7x, which is an estimate of what a reasonable P/E might be given factors such as the company’s earnings profile, its industry, profit margins, market capitalization and identified risks.
The Fair Ratio is more tailored than a simple comparison with peers or the broad industry because it attempts to adjust for company specific characteristics instead of assuming that all companies should trade on the same multiple. Comparing the current P/E of 30.1x with the Fair Ratio of 36.7x suggests the stock trades below this Fair Ratio.
Result: UNDERVALUED
P/E ratios tell one story, but what if the real opportunity lies elsewhere? Start investing in legacies, not executives. Discover our 20 top founder-led companies.
Upgrade Your Decision Making: Choose your NXP Semiconductors Narrative
Earlier it was mentioned that there is an even better way to understand valuation. Narratives are introduced here as your way to attach a clear story to your numbers, linking what you believe about NXP Semiconductors future revenue, earnings and margins to a specific forecast and Fair Value on Simply Wall St’s Community page. You can then compare that Fair Value with today’s price to help you decide whether the stock looks expensive or cheap on your terms. Each Narrative updates automatically when new news or earnings arrive. One investor might build a Narrative around a higher Fair Value of US$345 based on strong edge AI and automotive opportunities, while another focuses on a lower Fair Value of US$174 that puts more weight on auto cycle risks and management changes. Both perspectives sit side by side so you can choose which story fits your own view.
For NXP Semiconductors, however, we will make it really easy for you with previews of two leading NXP Semiconductors Narratives:
On one side you have a higher Fair Value case that leans into edge AI and automotive software potential. On the other, there is a more measured setup that leans on consensus forecasts and a tighter gap to the current share price. Lining them up side by side helps you see which assumptions feel closer to your own view.
🐂 NXP Semiconductors Bull Case
Fair Value: US$345.00
Gap to current price: about 8.3% below this Fair Value based on the last close of US$316.47
Revenue growth assumption: 13.93% a year
- Leans on edge AI and automotive software acquisitions such as Kinara, Aviva and TTTech Auto to support higher content per vehicle and a higher margin product mix.
- Highlights local-for-local manufacturing and cost control efforts as supports for more resilient earnings and better operating leverage over time.
- Flags meaningful risks around geopolitics, auto and industrial concentration, competition and regulation that could limit margins if conditions are less favorable than assumed.
🐻 NXP Semiconductors Bear Case
Fair Value: US$298.29
Gap to current price: about 6.1% above this Fair Value based on the last close of US$316.47
Revenue growth assumption: 10.36% a year
- Anchors on analyst consensus, tying the narrative to auto inventory normalization, industrial and IoT recovery and cost discipline to support earnings.
- Points out that competition in China, higher operating costs and multiple acquisitions could weigh on margins if demand or pricing soften.
- Frames the current share price as relatively close to the consensus target, so outcomes depend heavily on how auto demand, edge AI adoption and integration of acquisitions play out.
If you want to see how other investors connect these numbers into a full story and build your own view alongside them, you can move from these previews into the full Community Narratives on Simply Wall St, compare assumptions and then decide which narrative feels closest to how you see NXP Semiconductors.
To see how these results tie into long-term growth, risks, and valuation, check out the full range of community narratives for NXP Semiconductors on Simply Wall St. Add the company to your watchlist or portfolio so you'll be alerted when the story evolves.
Do you think there's more to the story for NXP Semiconductors? Head over to our Community to see what others are saying!

This article by Simply Wall St is general in nature. We provide commentary based on historical data and analyst forecasts only using an unbiased methodology and our articles are not intended to be financial advice. It does not constitute a recommendation to buy or sell any stock, and does not take account of your objectives, or your financial situation. We aim to bring you long-term focused analysis driven by fundamental data. Note that our analysis may not factor in the latest price-sensitive company announcements or qualitative material. Simply Wall St has no position in any stocks mentioned.
Have feedback on this article? Concerned about the content? Get in touch with us directly. Alternatively, email editorial-team@simplywallst.com