
- PRICING
- LIVE QUOTES
- LEARN
- HELP


EN
Is American Electric Power (AEP) Pricing In Too Much Future Growth After Recent Rally?
- Wondering if American Electric Power Company at US$128.87 is offering fair value today, or if the price is running ahead of itself? This article focuses squarely on what the numbers say about the stock.
- The stock is up 0.7% over the past week and 11.3% year to date, while the 1 year and 5 year returns sit at 29.2% and 80.0%. These figures can influence how the market is thinking about both upside and risk.
- Recent news coverage has centered on American Electric Power Company as a large regulated utility, with investors paying attention to how regulatory decisions, capital spending plans and interest rate expectations shape sentiment around the stock. These themes help frame the recent returns without relying on short term headlines alone.
- Right now, the company scores 3 out of 6 on Simply Wall St's valuation checks, which you can review in detail through its value score of 3/6. The next sections will break down the usual valuation tools and also point to a broader way of thinking about what the stock is worth.
Approach 1: American Electric Power Company Dividend Discount Model (DDM) Analysis
The Dividend Discount Model estimates what a stock might be worth by projecting future dividends and discounting them back to today, then comparing that figure with the current share price.
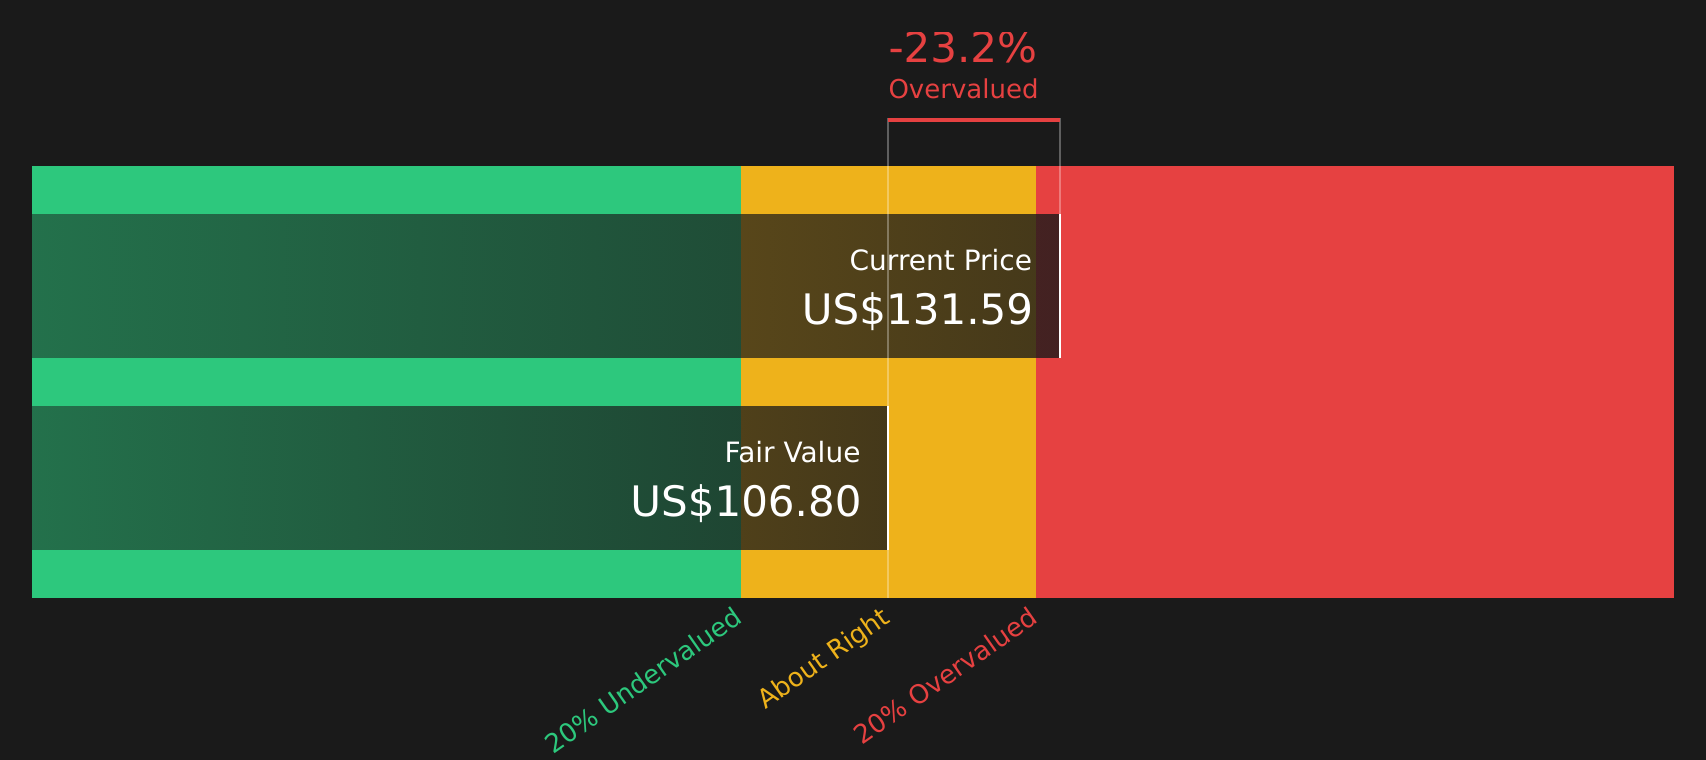
For American Electric Power Company, the model uses an annual dividend per share of about US$4.16, a return on equity of 10.51% and a payout ratio of 69.36%. This implies an estimated dividend growth rate of roughly 3.22%, calculated from the portion of earnings retained and reinvested, which is 30.64% of profits multiplied by the 10.51% return on equity.
Based on these inputs, the DDM output suggests an intrinsic value of around US$106.92 per share. With the stock trading at US$128.87, the DDM points to the shares trading about 20.5% above this intrinsic estimate, which indicates the stock screens as overvalued on this specific dividend based yardstick.
Result: OVERVALUED
Our Dividend Discount Model (DDM) analysis suggests American Electric Power Company may be overvalued by 20.5%. Discover 51 high quality undervalued stocks or create your own screener to find better value opportunities.
Approach 2: American Electric Power Company Price vs Earnings
For a profitable company, the P/E ratio is a straightforward way to relate what you pay for the stock to what the business currently earns. It gives you a quick sense of how many dollars investors are willing to pay today for each dollar of earnings.
What counts as a "normal" or "fair" P/E depends on how the market views the company’s growth prospects and risk. Higher expected growth or lower perceived risk can support a higher multiple, while slower growth or higher risk usually calls for a lower one.
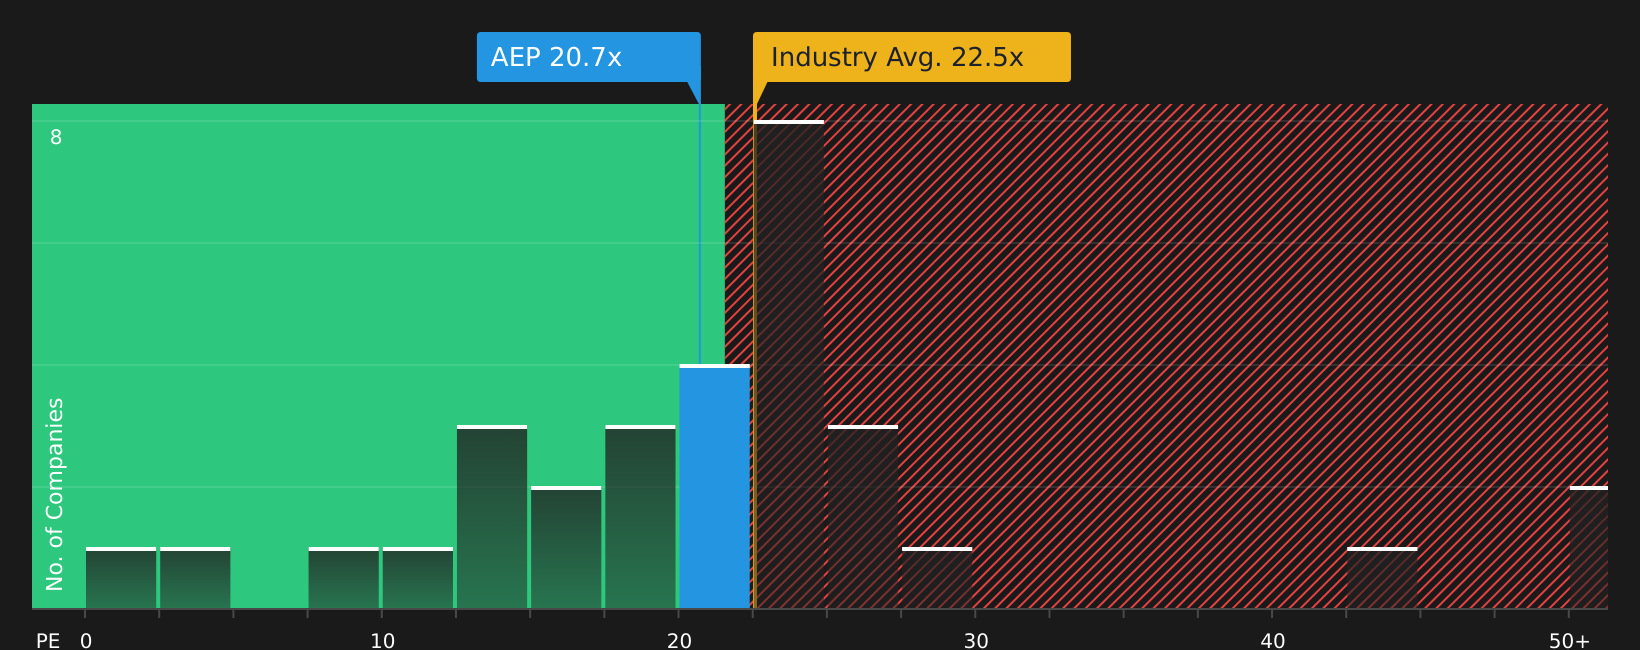
American Electric Power Company currently trades on a P/E of about 19.19x. That sits below the Electric Utilities industry average of 21.57x and the peer group average of 24.70x. Simply Wall St’s Fair Ratio for the stock is 25.32x, which reflects a proprietary view of what the P/E might be given factors such as earnings profile, industry, profit margins, market value and risk characteristics.
This Fair Ratio can be more informative than simple peer or industry comparisons because it ties the multiple to company specific traits rather than just where others trade. With the Fair Ratio above the current P/E, the stock screens as undervalued on this earnings based measure.
Result: UNDERVALUED
P/E ratios tell one story, but what if the real opportunity lies elsewhere? Start investing in legacies, not executives. Discover our 20 top founder-led companies.
Upgrade Your Decision Making: Choose your American Electric Power Company Narrative
Earlier it was mentioned that there is an even better way to understand valuation, and that is through Narratives, which are simply your story about American Electric Power Company, tied to explicit assumptions for future revenue, earnings, margins and a fair value. You can then compare this fair value with the current share price on the Simply Wall St Community page, where millions of investors publish and update their views as new news or earnings arrive. For example, one investor might build a more cautious AEP Narrative anchored around a fair value of about US$113 based on a focus on regulated stability. Another might build a more optimistic AEP Narrative closer to US$144 that leans on analyst revenue and earnings assumptions and a higher future P/E. The platform keeps these views current so you can quickly see how your own fair value stacks up against the latest price and decide whether the stock looks expensive or cheap on your terms.
For American Electric Power Company however we will make it really easy for you with previews of two leading American Electric Power Company Narratives:
🐂 American Electric Power Company Bull Case
Fair value: US$144.29
Gap to this fair value: about 10.7% above the recent price.
Revenue growth assumption: 7.09%
- Focuses on AEP’s planned US$54b capital program, potential extra US$10b of projects and expectations for higher retail load driven by commercial and industrial customers.
- Highlights a regulatory roadmap that seeks timely recovery of grid and generation spending, while pointing out risks from changing rules, tax legislation and supply chain pressures.
- Builds a fair value of US$144.29 on analyst assumptions for revenue, margins and a future P/E of about 22.7x, and suggests the current price sits not far from that consensus view.
🐻 American Electric Power Company Bear Case
Fair value: US$113.00
Gap to this fair value: about 14.0% above the narrative fair value.
Revenue growth assumption: 4.51%
- Frames AEP’s current valuation as rich, with the stock viewed as paying up for exposure to a large 56 GW load backlog tied to data centers and grid projects.
- Emphasizes that investors are treating AEP as a key grid provider for the AI era, with much of the earnings base tied to regulated transmission and distribution activities.
- Sees US$113 as a conservative floor based on assets, suggesting recent pricing reflects a re rating of the company’s role in power infrastructure rather than current cash flows alone.
Side by side, these two Narratives give you a structured bull and bear view on the same facts, so you can decide which assumptions about future demand, regulation and valuation feel more realistic for your own thesis.
To see how these results tie into long-term growth, risks, and valuation, check out the full range of community narratives for American Electric Power Company on Simply Wall St. Add the company to your watchlist or portfolio so you'll be alerted when the story evolves.
Do you think there's more to the story for American Electric Power Company? Head over to our Community to see what others are saying!

This article by Simply Wall St is general in nature. We provide commentary based on historical data and analyst forecasts only using an unbiased methodology and our articles are not intended to be financial advice. It does not constitute a recommendation to buy or sell any stock, and does not take account of your objectives, or your financial situation. We aim to bring you long-term focused analysis driven by fundamental data. Note that our analysis may not factor in the latest price-sensitive company announcements or qualitative material. Simply Wall St has no position in any stocks mentioned.
Have feedback on this article? Concerned about the content? Get in touch with us directly. Alternatively, email editorial-team@simplywallst.com