
- PRICING
- LIVE QUOTES
- LEARN
- HELP


EN
Is It Time To Reassess 3M (MMM) After Its Recent Share Price Rebound?
- Wondering whether 3M at around US$149 a share is starting to look like value, or if the recent moves are just noise around a mature industrial giant.
- The stock has gained 4.3% over the past week, even though it is still down 3.4% over the last 30 days, 7.7% year to date, and 1.3% over the past year, with a much stronger 93.7% return over three years and 5.3% over five years.
- Recent coverage has focused on 3M's ongoing role as a diversified industrial company and on how investors are reassessing long term prospects after a period of mixed share price performance. This context helps explain why some investors are now rechecking whether the current price lines up with fundamentals or simply reflects shifting sentiment.
- On Simply Wall St's valuation framework, 3M scores a 4 out of 6 valuation score, with each point reflecting where the stock screens as undervalued. The sections that follow will walk through the key valuation methods used and will also hint at an even richer way to think about value at the end of the article.
Approach 1: 3M Discounted Cash Flow (DCF) Analysis
A Discounted Cash Flow, or DCF, model looks at the cash 3M could generate in the future and discounts those projected amounts back to today to estimate what the stock might be worth right now.
For 3M, the model used is a 2 Stage Free Cash Flow to Equity approach, based on recent Free Cash Flow of about $1.79b. Analysts provide explicit forecasts for the next few years, and Simply Wall St then extends those projections further out using its own assumptions. By 2030, projected Free Cash Flow is $4.99b, with intermediate years stepping up from an estimated $3.82b in 2026 to $4.32b in 2027 and $4.58b in 2028, all in dollar terms.
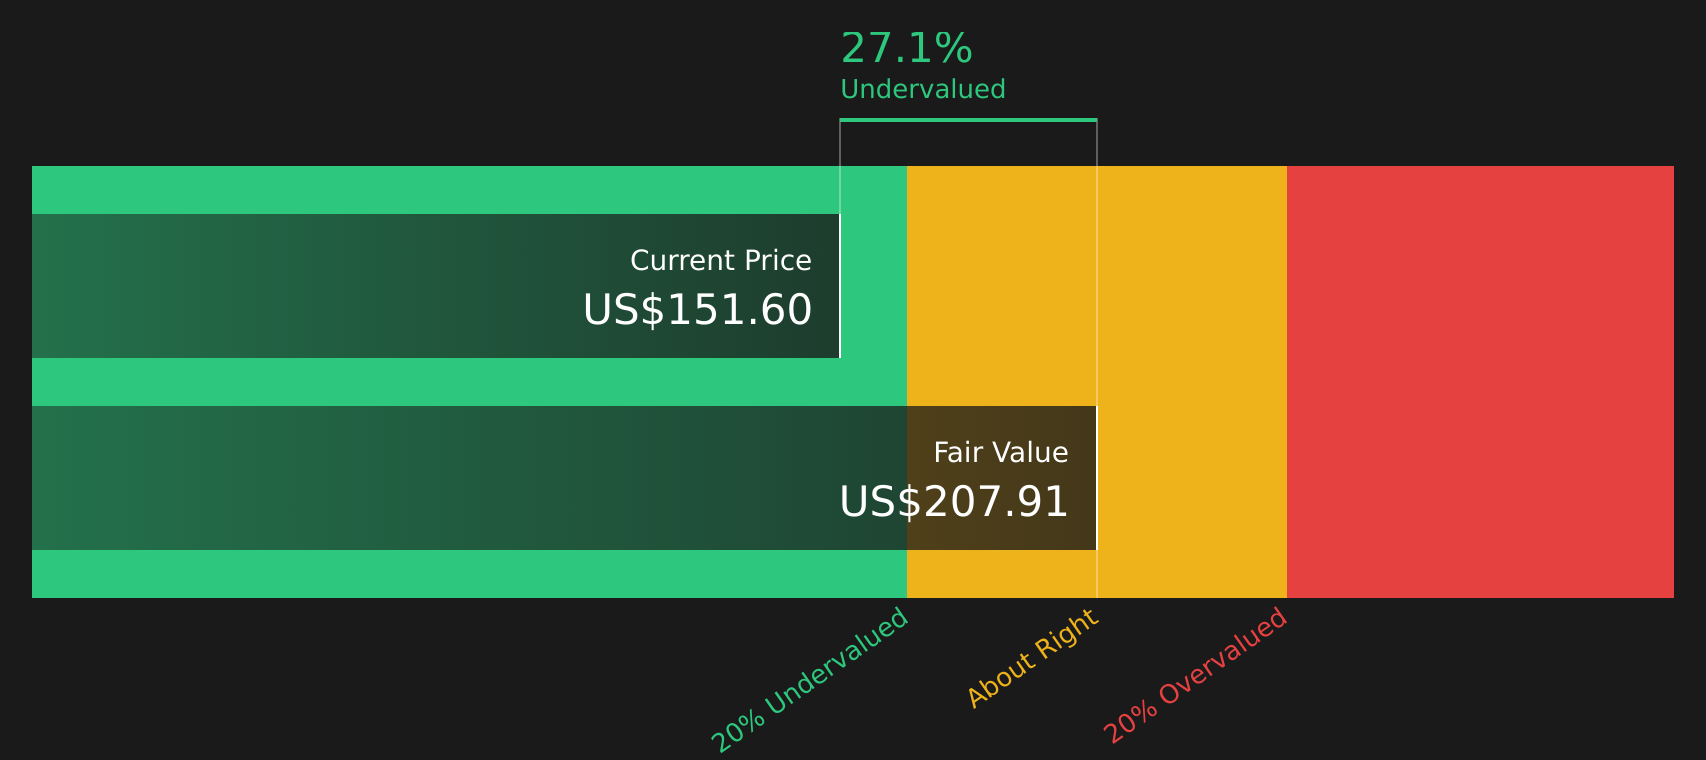
When these projected cash flows are discounted back and combined, the model arrives at an intrinsic value of about $207.86 per share. Compared to a recent share price of roughly $149, that indicates the stock screens as about 28.1% undervalued on this DCF framework.
Result: UNDERVALUED
Our Discounted Cash Flow (DCF) analysis suggests 3M is undervalued by 28.1%. Track this in your watchlist or portfolio, or discover 54 more high quality undervalued stocks.
Approach 2: 3M Price vs Earnings
For profitable companies like 3M, the P/E ratio is a useful way to relate what you pay for each share to the earnings that support it. Investors usually look for a P/E that lines up with the company’s earnings profile, with higher growth or lower perceived risk often justifying a higher “normal” P/E, and slower growth or higher risk pointing to a lower one.
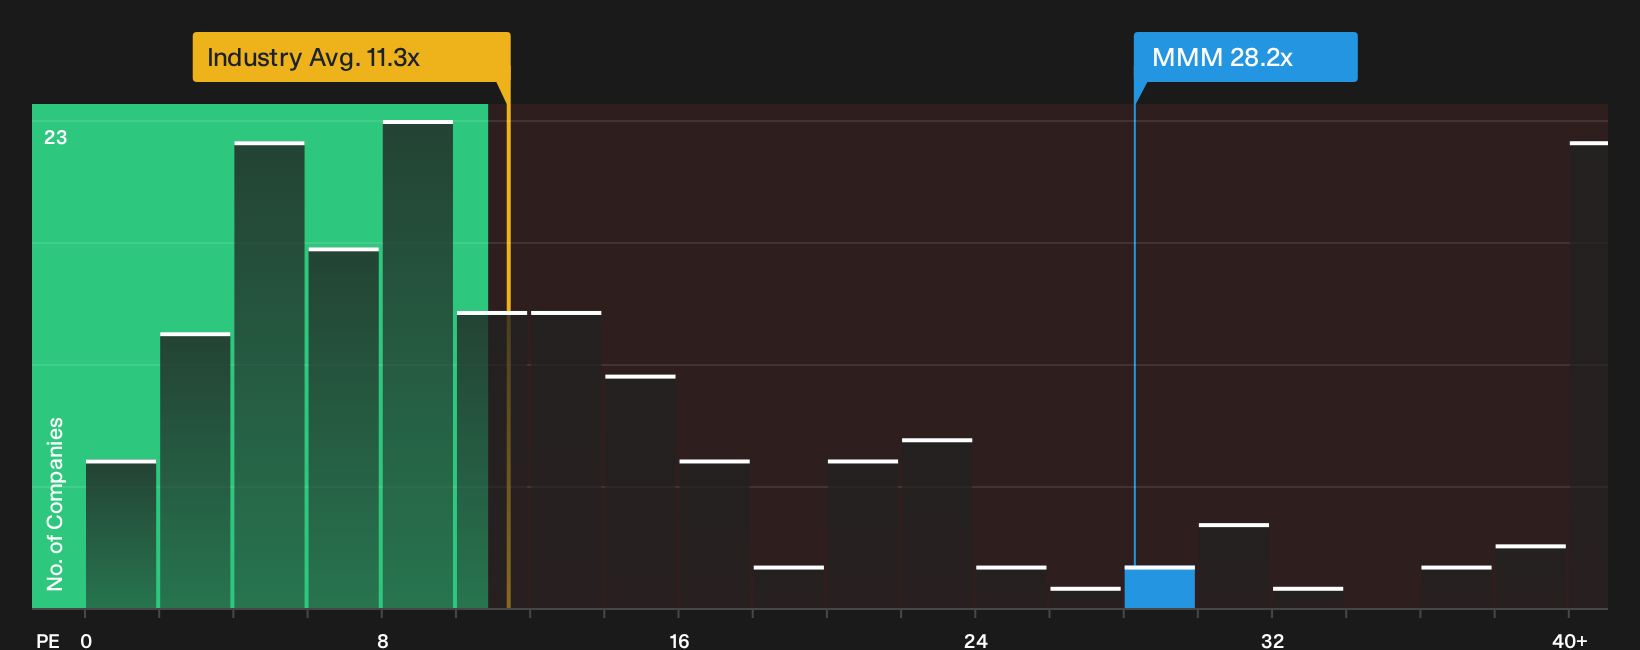
3M currently trades on a P/E of 27.95x. That sits above the broader Industrials sector average of 13.89x and is close to the peer group average of 28.74x. Taken together, that comparison suggests the stock is priced in line with similar companies rather than with the wider sector.
Simply Wall St’s Fair Ratio framework goes a step further. It estimates what P/E might be reasonable for 3M at 34.54x, based on factors such as earnings growth expectations, the company’s industry, profit margins, market value and identified risks. Because it adjusts for these company specific inputs, the Fair Ratio offers a more tailored benchmark than simple peer or industry averages. Comparing the Fair Ratio of 34.54x with the current P/E of 27.95x, 3M screens as undervalued on this metric.
Result: UNDERVALUED
P/E ratios tell one story, but what if the real opportunity lies elsewhere? Start investing in legacies, not executives. Discover our 19 top founder-led companies.
Upgrade Your Decision Making: Choose your 3M Narrative
Earlier it was mentioned that there is an even better way to understand valuation. Narratives are introduced as a simple way for you to attach a clear story about 3M to specific assumptions for its future revenue, earnings, margins and fair value, then compare that fair value with today’s price to decide whether the stock looks attractive, fully priced or expensive based on your own view.
On Simply Wall St’s Community page, Narratives let you pick or adapt a storyline, link it to a forecast and a fair value, and then see that view refresh automatically when new information such as earnings updates or news is added, so your decision rules stay current without you needing to rebuild a model each time.
For 3M, one investor might align with a more optimistic Narrative that points to a fair value around US$223.59, while another might favour a cautious Narrative closer to US$113.59, and the consensus view currently clusters around US$175.03. This gives you a clear range of perspectives to compare with the latest share price and decide which story you think is most reasonable.
For 3M however we'll make it really easy for you with previews of two leading 3M Narratives:
Fair value in this bullish narrative: about US$175.03 per share.
At the latest price of roughly US$149.36, the stock screens as about 14.7% below that fair value on this view.
Implied revenue growth in this scenario: about 2.77% a year.
- Analysts in this camp see 3M using product development, operational efficiency and focused investment to support higher margins and steady revenue growth.
- They assume earnings rise to about US$4.7b by 2029, with profit margins and share buybacks working together to lift earnings per share.
- This view leans on 3M managing legal and regulatory risks while keeping enough balance sheet flexibility to keep funding dividends and buybacks.
Fair value in this bearish narrative: about US$125.70 per share.
At the latest price of roughly US$149.36, the stock screens as about 18.8% above that fair value on this view.
Implied revenue growth in this scenario: about 1.16% a year.
- The cautious camp focuses on PFAS litigation, regulatory pressure and supply chain complexity as ongoing headwinds for cash flow and margins.
- They still factor in earnings growth, but with slower revenue trends and a lower assumed P/E, which pulls fair value down toward the low US$100s.
- This view treats the current share price as baking in more optimism on execution and legal outcomes than these analysts are comfortable with.
Your job as an investor is to decide which story feels closer to your own expectations for 3M, and how much room for error you want in either direction.
To see how these results tie into long-term growth, risks, and valuation, check out the full range of community narratives for 3M on Simply Wall St. Add the company to your watchlist or portfolio so you'll be alerted when the story evolves.
Do you think there's more to the story for 3M? Head over to our Community to see what others are saying!

This article by Simply Wall St is general in nature. We provide commentary based on historical data and analyst forecasts only using an unbiased methodology and our articles are not intended to be financial advice. It does not constitute a recommendation to buy or sell any stock, and does not take account of your objectives, or your financial situation. We aim to bring you long-term focused analysis driven by fundamental data. Note that our analysis may not factor in the latest price-sensitive company announcements or qualitative material. Simply Wall St has no position in any stocks mentioned.
Have feedback on this article? Concerned about the content? Get in touch with us directly. Alternatively, email editorial-team@simplywallst.com