
- PRICING
- LIVE QUOTES
- LEARN
- HELP


EN
A Look At Dorchester Minerals (DMLP) Valuation After Strong First Quarter 2026 Results
Dorchester Minerals (DMLP) is back on investors radar after reporting first quarter 2026 results. The company reported revenue of US$58.88 million and net income of US$28.26 million from continuing operations.
See our latest analysis for Dorchester Minerals.
The latest earnings release appears to have supported positive sentiment, with a 1-day share price return of 2.13% and a year to date share price return of 21.51%, while the 5-year total shareholder return of 220.45% reflects a strong longer term outcome.
If you are looking beyond Dorchester Minerals and want to see what else is moving in the resources space, take a look at our 33 elite gold producer stocks
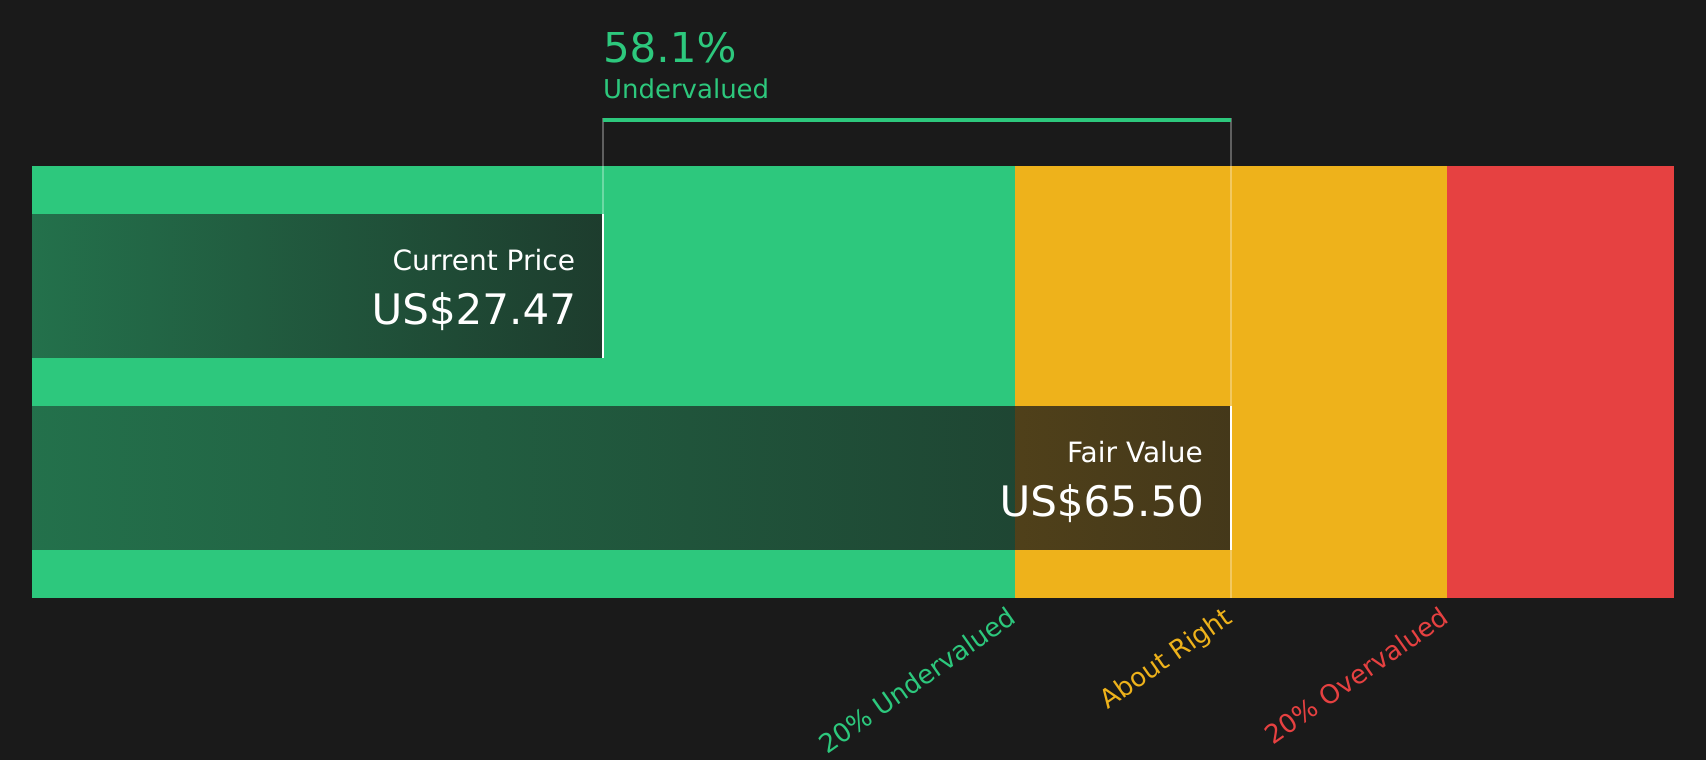
With the stock up 21.5% year to date and trading at an estimated 57% discount to intrinsic value, investors now face a key question: Is Dorchester Minerals still undervalued, or is the market already pricing in future growth?
Preferred P/E of 20.5x: Is it justified?
Dorchester Minerals trades on a P/E of 20.5x, which, at a last close of $28.25, indicates the market is paying a premium for its current earnings compared with peers.
The P/E ratio compares the share price with earnings per share, so a higher P/E usually means investors are paying more today for each dollar of current earnings. For a royalty-focused energy business, that can reflect views about the stability of cash flows or the quality of its asset base rather than rapid growth.
In this case, the SWS DCF model estimates a future cash flow value of $65.50 per unit, while the stock trades at $28.25, indicating a sizeable gap between the DCF view and the earnings multiple the market is currently applying. The model works by projecting future cash flows from Dorchester Minerals' portfolio of royalty interests and discounting them back to today at an appropriate rate, then comparing that value with the current price.
Against peers, Dorchester Minerals' P/E of 20.5x is higher than both the US Oil and Gas industry average of 14.9x and the peer average of 15.5x, so the stock is trading at a clear premium to its sector on an earnings basis even though it is trading at a reported 56.9% discount to the SWS DCF estimate of intrinsic value. That contrast presents investors with two different valuation signals to consider, one based on current earnings and one based on projected cash flows.
See what the numbers say about this price — find out in our valuation breakdown.
Result: Price-to-Earnings of 20.5x.
However, investors also need to weigh the risks, including exposure to commodity price swings and the possibility that the DCF assumptions on future cash flows are too optimistic.
Find out about the key risks to this Dorchester Minerals narrative.
Another View: Cash Flow Says Something Different
While the P/E of 20.5x suggests Dorchester Minerals trades at a premium to peers on earnings, the SWS DCF model points the other way. With an estimated future cash flow value of $65.50 per unit versus a $28.25 price, the model implies the stock is undervalued. Which signal carries more weight for you?
Look into how the SWS DCF model arrives at its fair value.
Simply Wall St performs a discounted cash flow (DCF) on every stock in the world every day (check out Dorchester Minerals for example). We show the entire calculation in full. You can track the result in your watchlist or portfolio and be alerted when this changes, or use our stock screener to discover 52 high quality undervalued stocks. If you save a screener we even alert you when new companies match - so you never miss a potential opportunity.
Next Steps
With mixed signals across earnings, cash flow and valuation, what matters most to you right now is forming your own judgment while the data is fresh. To weigh up both sides of the story quickly, start with the 1 key reward and 1 important warning sign.
Looking for more investment ideas?
Do not stop with one stock when you can quickly scan other opportunities that fit different goals, risk levels and income needs on the same platform.
- Target potential mispricings by reviewing companies that appear cheap on quality and fundamentals using the 52 high quality undervalued stocks.
- Lock in your income focus by checking out companies screened for robust payouts through the 12 dividend fortresses.
- Dial down risk by filtering for companies with resilient balance sheets and fundamentals through the solid balance sheet and fundamentals stocks screener (45 results).
This article by Simply Wall St is general in nature. We provide commentary based on historical data and analyst forecasts only using an unbiased methodology and our articles are not intended to be financial advice. It does not constitute a recommendation to buy or sell any stock, and does not take account of your objectives, or your financial situation. We aim to bring you long-term focused analysis driven by fundamental data. Note that our analysis may not factor in the latest price-sensitive company announcements or qualitative material. Simply Wall St has no position in any stocks mentioned.
Have feedback on this article? Concerned about the content? Get in touch with us directly. Alternatively, email editorial-team@simplywallst.com