
- PRICING
- LIVE QUOTES
- LEARN
- HELP


EN
3 Stocks Possibly Trading Below Estimated Value
Over the last 7 days, the United States market has risen by 1.5%, contributing to a notable 26% increase over the past year, with earnings expected to grow by 17% annually. In this environment of growth, identifying stocks that may be trading below their estimated value can offer potential opportunities for investors seeking to capitalize on undervalued assets.
Top 10 Undervalued Stocks Based On Cash Flows In The United States
| Name | Current Price | Fair Value (Est) | Discount (Est) |
| Tuniu (TOUR) | $5.94 | $11.44 | 48.1% |
| Travere Therapeutics (TVTX) | $42.84 | $84.03 | 49% |
| Rayonier (RYN) | $20.34 | $39.91 | 49% |
| Ramaco Resources (METC) | $16.51 | $32.27 | 48.8% |
| Kaspi.kz (KSPI) | $86.38 | $171.76 | 49.7% |
| iRhythm Holdings (IRTC) | $118.31 | $234.30 | 49.5% |
| FinWise Bancorp (FINW) | $12.98 | $25.54 | 49.2% |
| FB Financial (FBK) | $52.04 | $101.61 | 48.8% |
| CVR Energy (CVI) | $34.39 | $67.81 | 49.3% |
| Bitgo Holdings (BTGO) | $11.89 | $23.26 | 48.9% |
Let's uncover some gems from our specialized screener.
Kaspi.kz (KSPI)
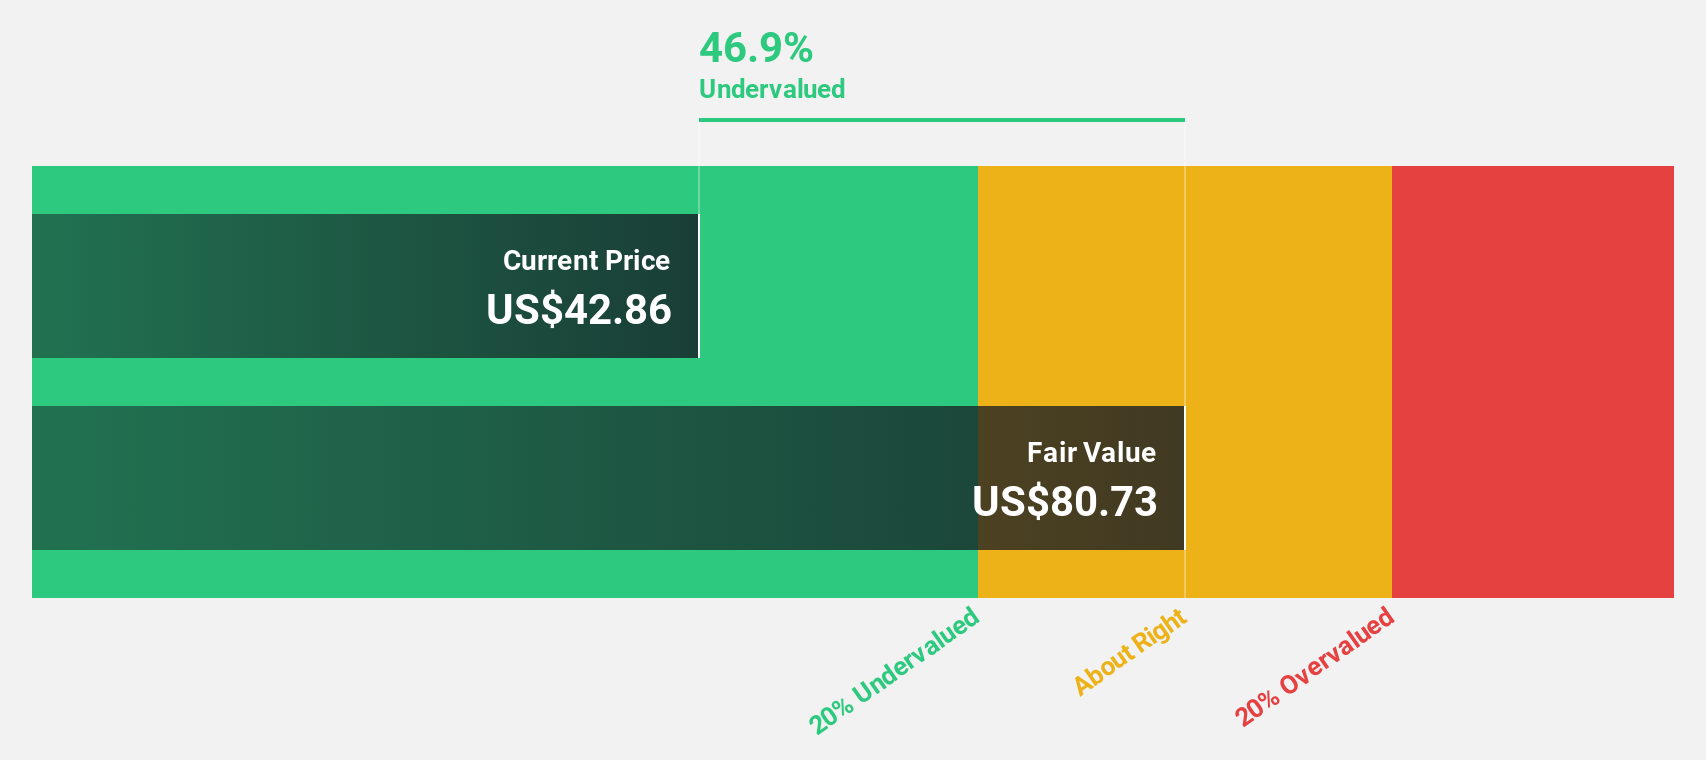
Overview: Joint Stock Company Kaspi.kz, with a market cap of $16.33 billion, operates in Kazakhstan, Azerbaijan, and Ukraine offering payments, marketplace, and fintech solutions for consumers and merchants.
Operations: Kaspi.kz's revenue is derived from its operations in payments, marketplace, and fintech solutions across Kazakhstan, Azerbaijan, and Ukraine.
Estimated Discount To Fair Value: 49.7%
Kaspi.kz is trading significantly below its estimated future cash flow value, indicating potential undervaluation. Despite a decline in profit margins from 40.9% to 26.5%, the company continues to exhibit robust revenue growth, with first-quarter earnings showing an increase in revenue to KZT 1,080.63 billion from KZT 821.85 billion year-over-year. The recent $600 million bond issuance enhances liquidity, although dividends remain inadequately covered by free cash flows at an 8.48% yield level.
- Upon reviewing our latest growth report, Kaspi.kz's projected financial performance appears quite optimistic.
- Click to explore a detailed breakdown of our findings in Kaspi.kz's balance sheet health report.
Uranium Energy (UEC)
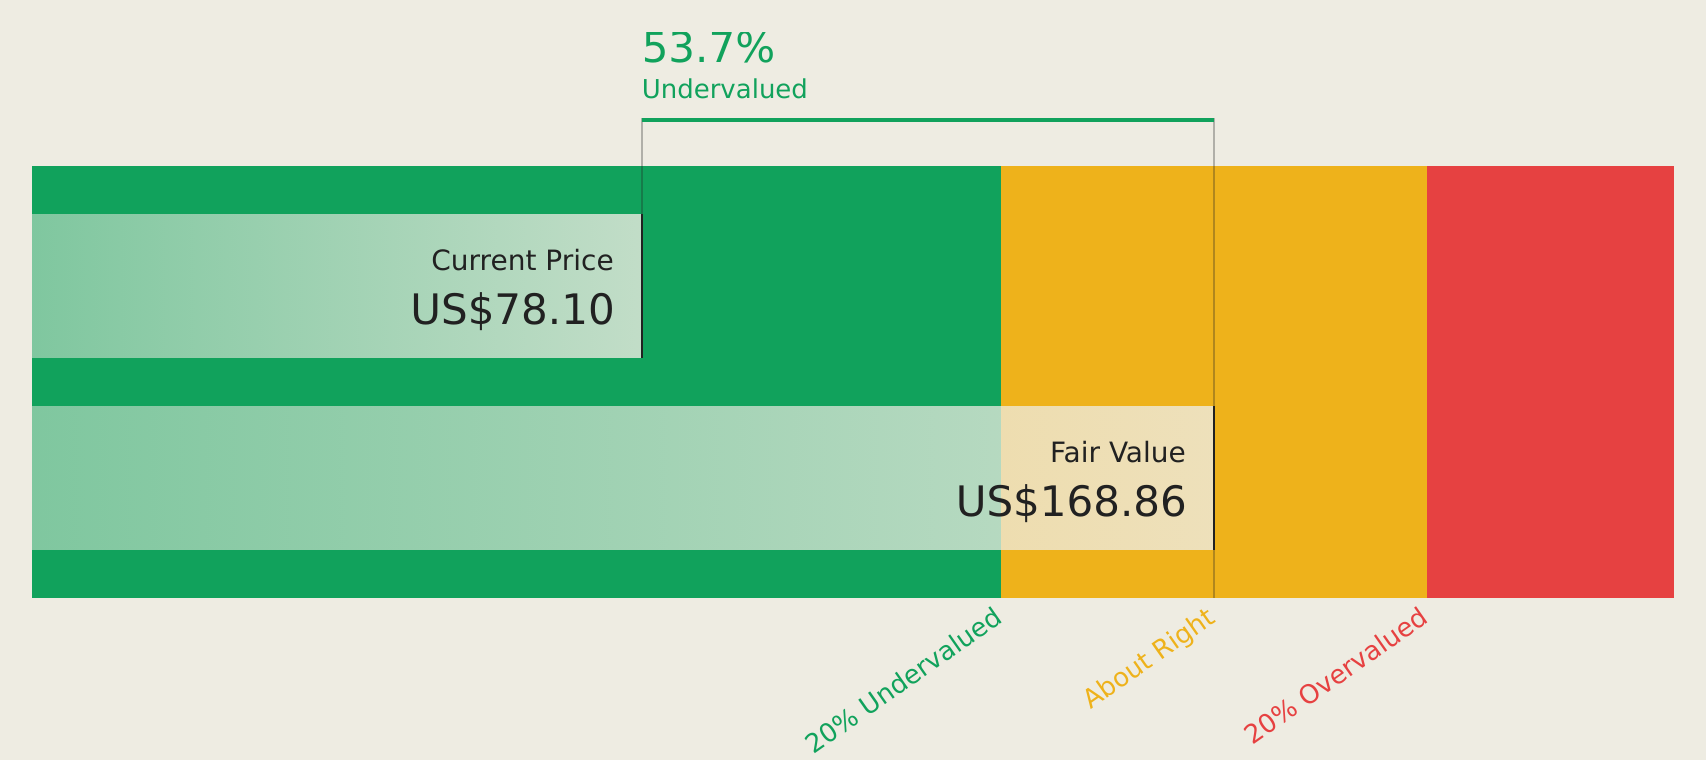
Overview: Uranium Energy Corp., along with its subsidiaries, is involved in the exploration, pre-extraction, extraction, and processing of uranium and titanium concentrates across the United States, Canada, and Paraguay with a market cap of approximately $8.07 billion.
Operations: The company's revenue segment is primarily from corporate and administrative activities, amounting to $20.20 million.
Estimated Discount To Fair Value: 41%
Uranium Energy Corp. is trading at US$15.5, significantly below its estimated future cash flow value of US$26.26, suggesting it may be undervalued based on cash flows. The company has commenced production at its Burke Hollow project and expanded capacity at Christensen Ranch, enhancing its U.S. uranium production base with two active ISR platforms. Despite reporting a net loss for the recent quarter, Uranium Energy's revenue is forecast to grow 46.4% annually, surpassing market expectations.
- Our expertly prepared growth report on Uranium Energy implies its future financial outlook may be stronger than recent results.
- Click here to discover the nuances of Uranium Energy with our detailed financial health report.
Cactus (WHD)
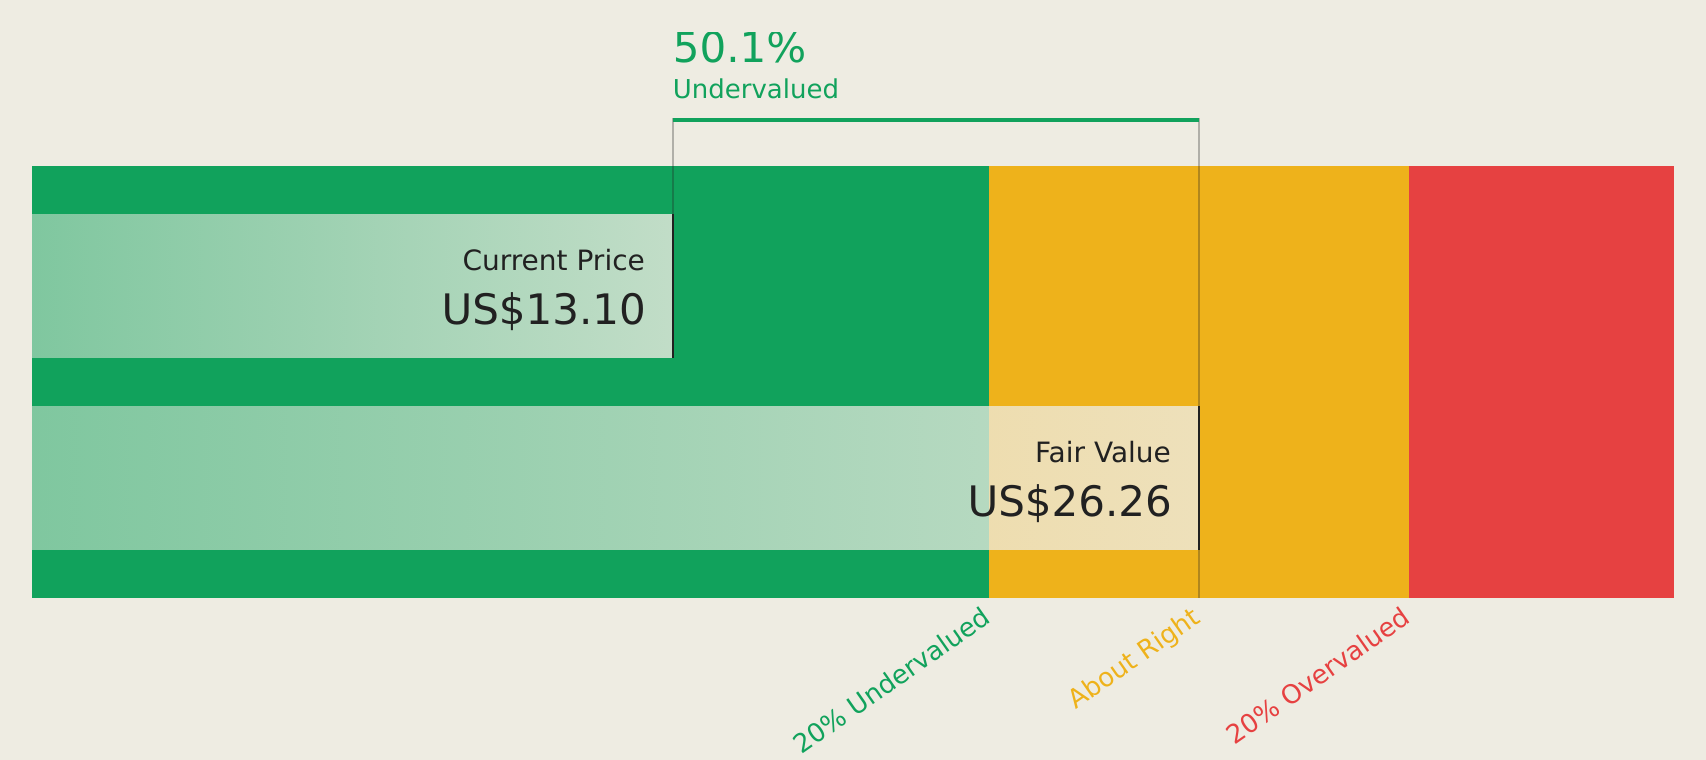
Overview: Cactus, Inc. designs, manufactures, sells, and rents engineered pressure control and spoolable pipe technologies across various international markets with a market cap of approximately $4.53 billion.
Operations: The company generates revenue from its Pressure Control segment, which accounts for $827.09 million, and its Spoolable Technologies segment, contributing $365.57 million.
Estimated Discount To Fair Value: 45.2%
Cactus, Inc. is trading at US$57.23, well below its estimated future cash flow value of US$104.39, indicating potential undervaluation based on cash flows. Despite a recent decline in net income to US$32.91 million for Q1 2026 from US$44.22 million a year ago, earnings are forecast to grow significantly by 56.34% annually over the next three years, outpacing the broader U.S. market's growth expectations and highlighting its strong profit growth potential despite current challenges.
- According our earnings growth report, there's an indication that Cactus might be ready to expand.
- Click here and access our complete balance sheet health report to understand the dynamics of Cactus.
Next Steps
- Investigate our full lineup of 144 Undervalued US Stocks Based On Cash Flows right here.
- Are you invested in these stocks already? Keep abreast of every twist and turn by setting up a portfolio with Simply Wall St, where we make it simple for investors like you to stay informed and proactive.
- Elevate your portfolio with Simply Wall St, the ultimate app for investors seeking global market coverage.
Searching for a Fresh Perspective?
- Explore high-performing small cap companies that haven't yet garnered significant analyst attention.
- Diversify your portfolio with solid dividend payers offering reliable income streams to weather potential market turbulence.
- Fuel your portfolio with companies showing strong growth potential, backed by optimistic outlooks both from analysts and management.
This article by Simply Wall St is general in nature. We provide commentary based on historical data and analyst forecasts only using an unbiased methodology and our articles are not intended to be financial advice. It does not constitute a recommendation to buy or sell any stock, and does not take account of your objectives, or your financial situation. We aim to bring you long-term focused analysis driven by fundamental data. Note that our analysis may not factor in the latest price-sensitive company announcements or qualitative material. Simply Wall St has no position in any stocks mentioned.
Have feedback on this article? Concerned about the content? Get in touch with us directly. Alternatively, email editorial-team@simplywallst.com