
- PRICING
- LIVE QUOTES
- LEARN
- HELP


EN
Assessing Tronox Holdings (TROX) Valuation After Strong Year To Date Gains And Recent Share Price Pullback
What Tronox Holdings (TROX) investors are watching now
Tronox Holdings (TROX) has been drawing attention after recent share price moves, with the stock showing a 17% decline over the past week and a smaller pullback over the past month.
At a last close of US$8.42 and a market value of about US$1.6b, Tronox sits against a mixed return profile, including a 13% gain over the past 3 months and a 97% rise year to date.
See our latest analysis for Tronox Holdings.
The sharp 17% one day share price drop sits against a strong year to date share price return of 97% and a 1 year total shareholder return of 75%, so momentum has cooled but longer term gains remain significant.
If Tronox’s swings have you thinking about where else growth stories could emerge in materials, it may be worth scanning 33 best rare earth metal stocks
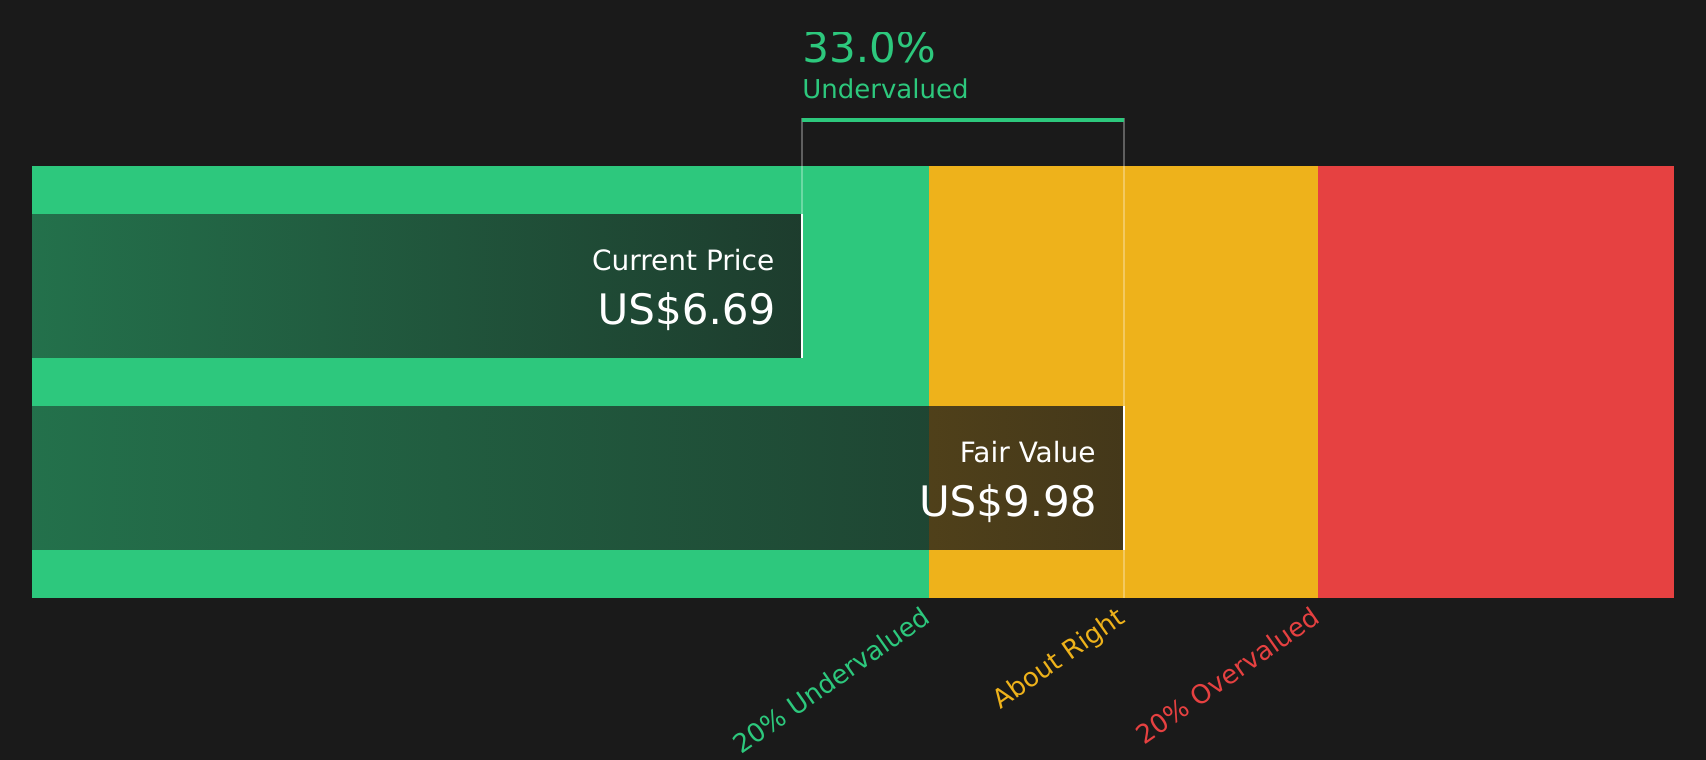
With Tronox trading at US$8.42, sitting below one estimate of intrinsic value yet slightly above one analyst price target, investors have to decide whether this is a genuine value opportunity or whether the market is already pricing in future growth.
Most Popular Narrative: 7% Overvalued
At $8.42, the most followed narrative implies Tronox trades above its fair value estimate of $7.88, so the story hinges on how future earnings evolve against that benchmark.
The company's ongoing cost improvement program and operational efficiency initiatives, including vertical integration and strategic mining investments, are anticipated to deliver $125 million to $175 million in sustainable annual savings by the end of 2026 and lower unit feedstock costs in 2026, which should enhance net margins and overall profitability beyond current expectations.
Curious how a business that is currently loss making could still support this fair value math? The narrative leans on a specific mix of revenue growth, margin repair, and a relatively low future earnings multiple to justify that $7.88 figure.
Result: Fair Value of $7.88 (OVERVALUED)
Have a read of the narrative in full and understand what's behind the forecasts.
However, you still need to weigh risks, including Tronox's reported loss of US$462 million and net debt of US$2.9b, which could reduce its financial flexibility in the future.
Find out about the key risks to this Tronox Holdings narrative.
Another View: Cash Flow Points the Other Way
While the most followed narrative suggests Tronox trades about 7% above a fair value of $7.88, our DCF model presents a different view. It indicates the stock is trading around 37% below an estimated future cash flow value of $13.34. Which set of assumptions do you trust more, earnings or cash flow?
Look into how the SWS DCF model arrives at its fair value.
Next Steps
With mixed signals on value, risk and potential upside, this is the moment to review the full picture yourself by balancing both the concern and optimism that other investors see through 2 key rewards and 4 important warning signs
Looking for more investment ideas?
If Tronox has caught your attention, do not stop here. Cast a wider net with focused stock lists that could surface ideas you would not have spotted otherwise.
- Target potential bargains by checking companies that combine quality metrics with discounted pricing through the 51 high quality undervalued stocks
- Prioritize resilience by reviewing companies that show robust finances in the solid balance sheet and fundamentals stocks screener (44 results)
- Uncover off-the-radar opportunities by scanning the screener containing 23 high quality undiscovered gems
This article by Simply Wall St is general in nature. We provide commentary based on historical data and analyst forecasts only using an unbiased methodology and our articles are not intended to be financial advice. It does not constitute a recommendation to buy or sell any stock, and does not take account of your objectives, or your financial situation. We aim to bring you long-term focused analysis driven by fundamental data. Note that our analysis may not factor in the latest price-sensitive company announcements or qualitative material. Simply Wall St has no position in any stocks mentioned.
Have feedback on this article? Concerned about the content? Get in touch with us directly. Alternatively, email editorial-team@simplywallst.com