
- PRICING
- LIVE QUOTES
- LEARN
- HELP


EN
Is It Too Late To Consider Virtu Financial (VIRT) After Its Strong Year To Date Rally?
- Wondering whether Virtu Financial is priced attractively right now, or if the easy gains are already behind it? This article focuses squarely on what you are getting for the current share price.
- The stock last closed at US$49.54, with returns of 3.9% over 30 days, 52.0% year to date and 19.5% over the past year, which raises fair questions about how much value is already reflected in the price.
- Recent headlines have focused on Virtu Financial's role in capital markets and how trading conditions influence its business model, giving investors more data points to weigh against the share price moves. This mix of market commentary and company specific news gives useful background for judging whether the current valuation feels comfortable for your risk tolerance.
- On Simply Wall St's 6 point valuation framework, Virtu Financial scores 5 out of 6. Next up is a breakdown of the standard valuation checks and ratios that sit behind that score, followed by a way to think about value that goes beyond the usual multiples.
Approach 1: Virtu Financial Excess Returns Analysis
The Excess Returns model asks a simple question: are shareholders earning more on their equity than the required return, and if so, what is that stream of extra earnings worth today?
For Virtu Financial, the model uses a Book Value of US$19.94 per share and an Average Return on Equity of 33.23%. That translates into a Stable EPS estimate of US$6.47 per share, based on weighted future Return on Equity estimates from 4 analysts. The required return, or Cost of Equity, is US$1.80 per share, so the implied Excess Return is US$4.67 per share above that requirement.
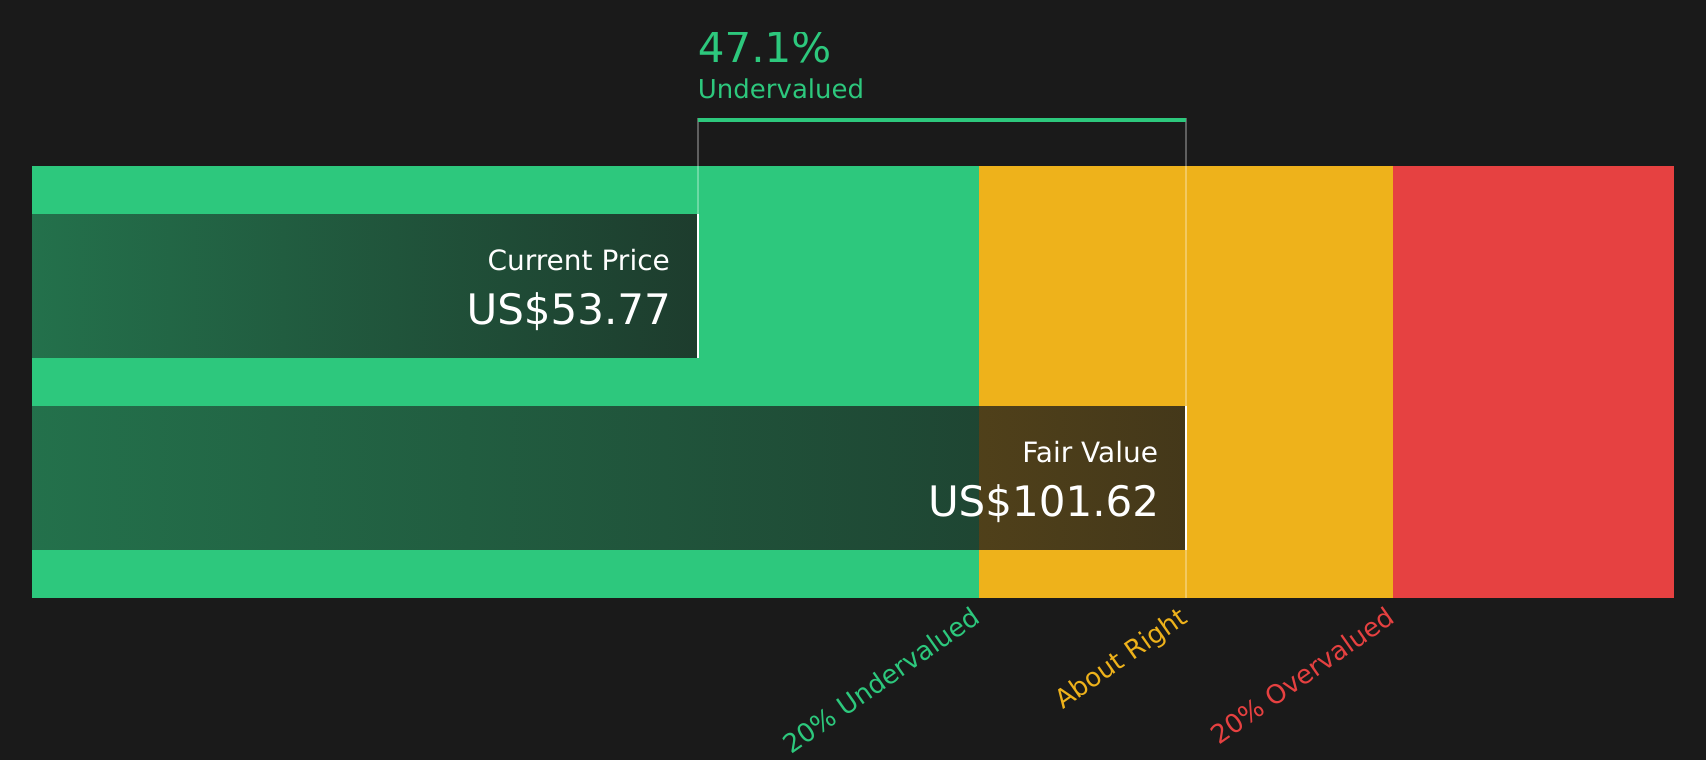
The analysis assumes a Stable Book Value of US$19.47 per share, based on estimates from 2 analysts, and projects the present value of those excess returns over time. Putting this together, the Excess Returns model arrives at an intrinsic value of about US$100.97 per share.
Against the recent share price of US$49.54, this implies the stock trades at a 50.9% discount, which points to Virtu Financial looking materially undervalued on this framework.
Result: UNDERVALUED
Our Excess Returns analysis suggests Virtu Financial is undervalued by 50.9%. Track this in your watchlist or portfolio, or discover 51 more high quality undervalued stocks.
Approach 2: Virtu Financial Price vs Earnings
For profitable companies like Virtu Financial, the P/E ratio is a useful yardstick because it relates what you pay for the stock to the earnings it currently generates. It gives a quick sense of how many dollars investors are willing to pay for each dollar of earnings.
What counts as a "normal" or "fair" P/E ratio depends on how the market views a company's growth potential and risk. Higher growth expectations or lower perceived risk usually justify a higher P/E, while lower growth or higher risk tend to support a lower P/E.
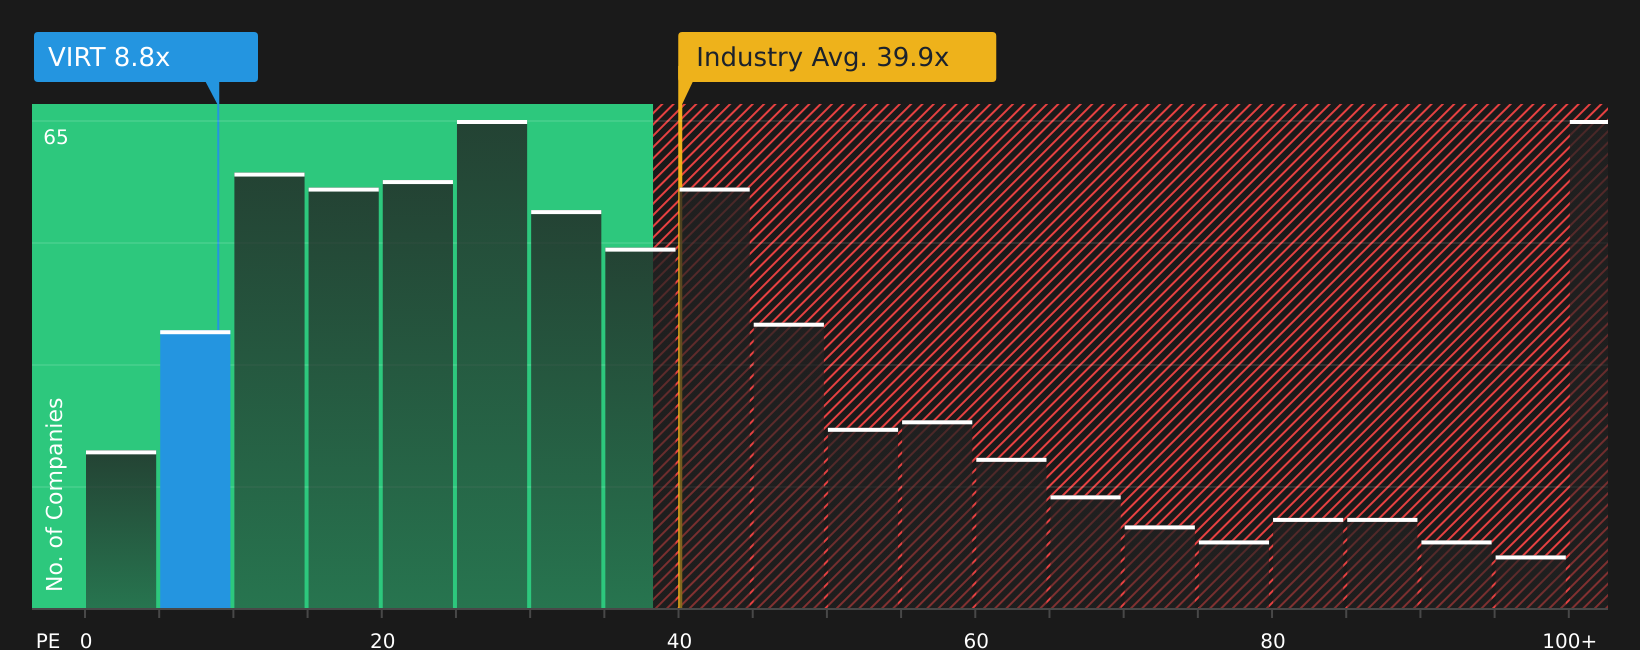
Virtu Financial currently trades on a P/E of 8.35x. That sits well below the Capital Markets industry average P/E of 41.88x and below the peer group average of about 20.00x. Simply Wall St also calculates a proprietary “Fair Ratio” of 14.56x for Virtu Financial. This Fair Ratio aims to capture the P/E that might be reasonable for the stock given factors such as its earnings profile, industry, profit margins, market cap and risk characteristics.
Because the Fair Ratio adjusts for these company specific factors, it can give a more tailored view than simple peer or industry comparisons. Setting the current P/E of 8.35x against the Fair Ratio of 14.56x suggests the stock trades on a lower multiple than might be expected.
Result: UNDERVALUED
P/E ratios tell one story, but what if the real opportunity lies elsewhere? Start investing in legacies, not executives. Discover our 18 top founder-led companies.
Upgrade Your Decision Making: Choose your Virtu Financial Narrative
Earlier it was mentioned that there is an even better way to understand valuation. This is where Narratives come in, giving you a clear story behind the numbers by letting you spell out how you think Virtu Financial’s revenue, earnings, margins and fair value fit together. The Narrative then links that story to a financial forecast and a fair value that you can compare with the current share price to decide whether the stock looks attractive or expensive for you.
On Simply Wall St’s Community page, Narratives are an accessible tool used by millions of investors. They update automatically when new information like news or earnings is added, so your view on Virtu Financial can adjust as conditions change without you rebuilding the whole model from scratch.
For Virtu Financial today, one investor might build a cautious Narrative around a fair value of about US$10.71 per share, while another might lean into a more optimistic Narrative around US$57.00. Seeing those two valuation stories side by side gives you a practical range to reflect on as you form your own view.
For Virtu Financial however we will make it really easy for you with previews of two leading Virtu Financial Narratives:
Fair value in this bullish Narrative: US$57.00 per share
Discount to that fair value at the last close of US$49.54: about 13.1%
Revenue growth assumption: 7.94% decline per year
- Analysts in this bullish camp keep the fair value at US$57.00, with updated work focused on discount rates, margins and future P/E levels as the main drivers.
- They factor in revenue declining at a mid single digit rate while modelling higher net profit margins and a modestly lower future P/E multiple.
- The Narrative leans on Virtu Financial’s ability to use cost discipline, technology and product expansion to support earnings power against regulatory and competitive risks.
Fair value in this cautious Narrative: US$10.71 per share
Premium to that fair value at the last close of US$49.54: about 362.6%
Revenue growth assumption: 6.76% decline per year
- This Narrative treats Virtu Financial as trading far above a fair value anchored around more modest profit margins, a higher discount rate and a future P/E of about 16.0x.
- The author highlights that recent share price moves and headlines could leave the stock vulnerable if expectations around cash flow and growth prove too optimistic.
- It urges investors to compare the current price with the US$10.71 fair value and to pressure test assumptions about cash generation, volatility sensitive earnings and long term sustainability.
These two Narratives frame a wide valuation range. The key step now is to decide which set of assumptions feels closer to your own view of Virtu Financial’s risks, earnings potential and suitable P/E multiple.
To see how these results tie into long-term growth, risks, and valuation, check out the full range of community narratives for Virtu Financial on Simply Wall St. Add the company to your watchlist or portfolio so you'll be alerted when the story evolves.
Do you think there's more to the story for Virtu Financial? Head over to our Community to see what others are saying!

This article by Simply Wall St is general in nature. We provide commentary based on historical data and analyst forecasts only using an unbiased methodology and our articles are not intended to be financial advice. It does not constitute a recommendation to buy or sell any stock, and does not take account of your objectives, or your financial situation. We aim to bring you long-term focused analysis driven by fundamental data. Note that our analysis may not factor in the latest price-sensitive company announcements or qualitative material. Simply Wall St has no position in any stocks mentioned.
Have feedback on this article? Concerned about the content? Get in touch with us directly. Alternatively, email editorial-team@simplywallst.com