
- PRICING
- LIVE QUOTES
- LEARN
- HELP


EN
Is It Too Late To Consider NWPX Infrastructure (NWPX) After Its Surging Share Price?
- This article examines what NWPX Infrastructure's current share price may be implying, and whether the stock still appears attractively priced after its recent gains or if much of the apparent value has already been realized.
- The stock last closed at US$111.41, with returns of 28.3% over 7 days, 39.8% over 30 days, 76.8% year to date, 195.5% over 1 year, 317.7% over 3 years and 249.4% over 5 years. These figures may have influenced how some investors view its potential and its risks.
- These moves have occurred against a backdrop of ongoing infrastructure and construction interest around NWPX Infrastructure. Investors have been reacting to sector-wide sentiment and company-specific developments that are not limited to any single announcement. Together, this context helps explain why the stock has recently attracted attention from both growth-focused and value-focused investors.
- NWPX Infrastructure currently has a valuation score of 2/6. The rest of this article reviews standard valuation approaches and then concludes with a broader framework for thinking about value that looks beyond the usual ratios and models.
NWPX Infrastructure scores just 2/6 on our valuation checks. See what other red flags we found in the full valuation breakdown.
Approach 1: NWPX Infrastructure Discounted Cash Flow (DCF) Analysis
A Discounted Cash Flow, or DCF, model estimates what a stock could be worth by projecting future cash flows and then discounting them back to today using a required rate of return.
For NWPX Infrastructure, the model used is a 2 Stage Free Cash Flow to Equity approach. The company’s last twelve months Free Cash Flow is about $70.4 million. Analyst and extrapolated projections, all in $, range from around $48.6 million in 2026 to about $51.2 million in 2035, with interim years such as 2030 projected at $47.9 million. Simply Wall St only uses direct analyst inputs for the earlier years, with later cash flows extrapolated from those estimates.
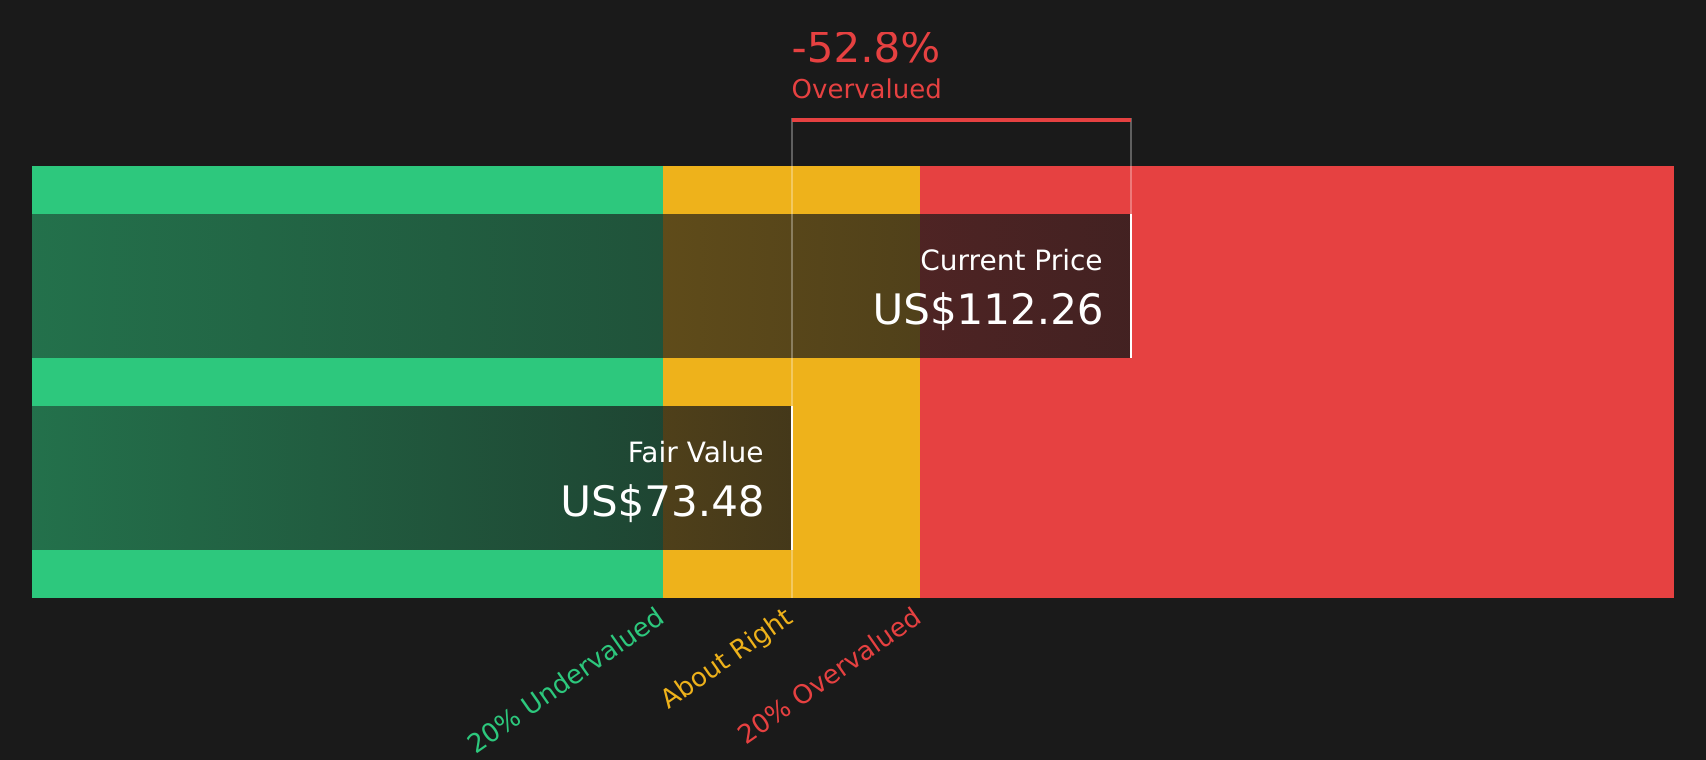
When these projected cash flows are discounted back, the model arrives at an estimated intrinsic value of about $73.65 per share. Compared with the recent share price of $111.41, the DCF output implies NWPX Infrastructure is about 51.3% overvalued based on these assumptions.
Result: OVERVALUED
Our Discounted Cash Flow (DCF) analysis suggests NWPX Infrastructure may be overvalued by 51.3%. Discover 50 high quality undervalued stocks or create your own screener to find better value opportunities.
Approach 2: NWPX Infrastructure Price vs Earnings
For a profitable company, the P/E ratio is a useful way to compare what you are paying for each dollar of current earnings. It helps you quickly see how the stock is priced relative to its own earnings power.
What counts as a "normal" P/E often reflects how the market views a company's growth prospects and risk profile. Higher growth expectations or lower perceived risk can support a higher P/E, while slower growth or higher risk typically align with a lower multiple.
NWPX Infrastructure currently trades on a P/E of 25.57x. That sits below the Construction industry average of about 45.85x and below a peer average of 47.51x. Simply Wall St also provides a proprietary Fair Ratio estimate of 17.47x, which is the P/E level that might be expected given factors such as the company's earnings growth profile, profit margins, industry, market cap and risk characteristics.
This Fair Ratio is more tailored than a simple comparison with peers or the broad industry, because it adjusts for company specific drivers rather than assuming all stocks deserve the same multiple. Comparing 25.57x with the Fair Ratio of 17.47x suggests NWPX Infrastructure is trading at a richer valuation than this framework would imply.
Result: OVERVALUED

P/E ratios tell one story, but what if the real opportunity lies elsewhere? Start investing in legacies, not executives. Discover our 17 top founder-led companies.
Upgrade Your Decision Making: Choose your NWPX Infrastructure Narrative
Earlier it was mentioned that there is an even better way to think about valuation, and on Simply Wall St that means using Narratives. With Narratives, you spell out the story you believe about NWPX Infrastructure, link that story to specific forecasts for future revenue, earnings and margins, and arrive at your own Fair Value that you can compare with the current share price to help decide whether the stock looks attractive or stretched for you.
A Narrative is simply your explanation for why the numbers should look a certain way. On the Community page you can pick or adapt views that range from a more cautious stance, such as a Fair Value of about US$50 based on slower revenue growth and lower margins, through to a more optimistic stance, such as a Fair Value of about US$72 tied to firmer demand and higher profitability. Those Narratives will refresh as new news or earnings arrive so your framework stays current rather than static.
Do you think there's more to the story for NWPX Infrastructure? Head over to our Community to see what others are saying!

This article by Simply Wall St is general in nature. We provide commentary based on historical data and analyst forecasts only using an unbiased methodology and our articles are not intended to be financial advice. It does not constitute a recommendation to buy or sell any stock, and does not take account of your objectives, or your financial situation. We aim to bring you long-term focused analysis driven by fundamental data. Note that our analysis may not factor in the latest price-sensitive company announcements or qualitative material. Simply Wall St has no position in any stocks mentioned.
Have feedback on this article? Concerned about the content? Get in touch with us directly. Alternatively, email editorial-team@simplywallst.com