
- PRICING
- LIVE QUOTES
- LEARN
- HELP


EN
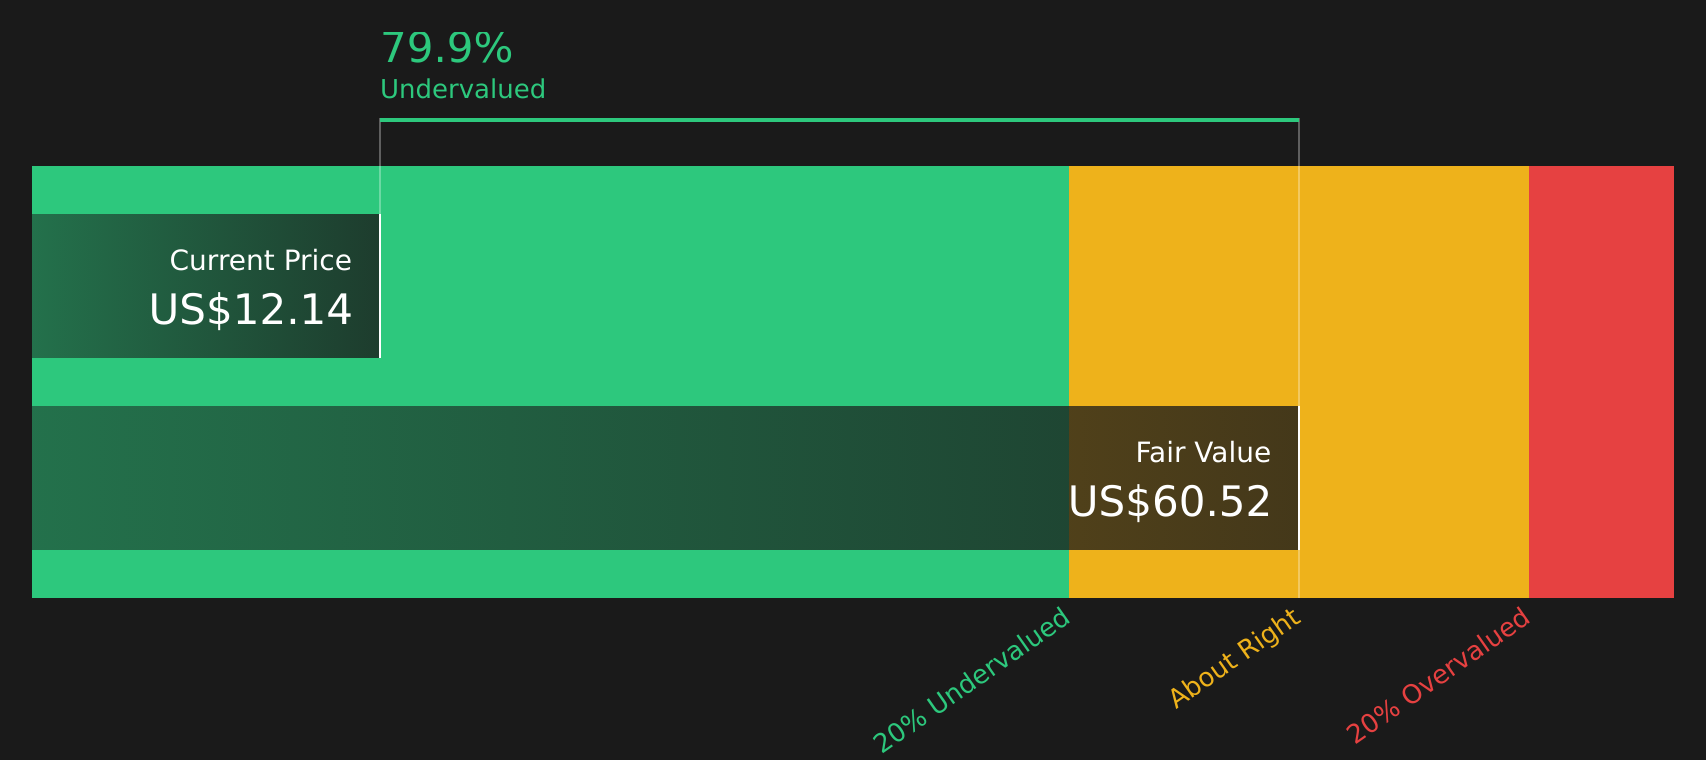
Is Daqo New Energy (DQ) Pricing Look Attractive After Recent Share Price Slide
- If you are wondering whether Daqo New Energy's current share price reflects its true worth, it helps to start with how the market has been treating the stock lately.
- The shares last closed at US$19.14, with returns of a 16.7% decline over 7 days, a 9.3% decline over 30 days, and a 35.5% decline year to date, contrasted with a 48.5% gain over the past year and larger declines of 57.2% and 74.4% over 3 and 5 years.
- These moves have played out against a backdrop of ongoing interest in the solar and semiconductor supply chain, where investors frequently reassess expectations for raw material suppliers and equipment makers. Sector headlines around pricing, capacity decisions, and global demand for solar-related products often influence sentiment toward companies like Daqo New Energy even without company specific announcements.
- On Simply Wall St's valuation framework, Daqo New Energy earns a value score of 4 out of 6, which sets up a closer look at different valuation methods and hints at an even broader way to think about value that will be covered at the end of this article.
Find out why Daqo New Energy's 48.5% return over the last year is lagging behind its peers.
Approach 1: Daqo New Energy Discounted Cash Flow (DCF) Analysis
A DCF model estimates what a stock could be worth by projecting future cash flows and discounting them back to today using a required rate of return. For Daqo New Energy, the model used is a 2 Stage Free Cash Flow to Equity approach based on cash flow projections.
The latest twelve month free cash flow is a loss of $244.62 million, so the starting point is negative. Looking ahead, analysts and extrapolations point to free cash flow of $262.67 million in 2028, with a series of annual projections running out to 2035. These figures, all in $, are discounted back by Simply Wall St to reflect the time value of money and risk.
Putting those discounted cash flows together gives an estimated intrinsic value of about $42.43 per share, compared with a recent share price of $19.14. On this basis, the DCF suggests Daqo New Energy trades at roughly a 54.9% discount and screens as materially undervalued on this model alone.
Result: UNDERVALUED
Our Discounted Cash Flow (DCF) analysis suggests Daqo New Energy is undervalued by 54.9%. Track this in your watchlist or portfolio, or discover 51 more high quality undervalued stocks.
Approach 2: Daqo New Energy Price vs Sales
For companies where earnings can be volatile, investors often focus on the P/S ratio, because it compares the share price to revenue rather than profit, which can swing more from year to year.
What counts as a normal P/S ratio depends a lot on how quickly the market expects sales to grow and how risky those sales are. Higher expected growth and lower perceived risk usually justify a higher multiple, while slower growth or higher uncertainty point to a lower one.
Daqo New Energy currently trades on a P/S of 1.95x. That is below the Semiconductor industry average P/S of 8.11x and also below the peer group average of 18.43x. To put this in context, Simply Wall St estimates a Fair Ratio of 1.01x for Daqo New Energy. This proprietary metric aims to capture what a reasonable P/S might be once factors such as earnings growth, profit margins, size, industry, and specific risks are taken into account.
Because the Fair Ratio adjusts for these company specific factors, it can often give a more tailored signal than a simple comparison with sector or peer averages. With Daqo New Energy trading at 1.95x versus a Fair Ratio of 1.01x, the shares screen as overvalued on this measure.
Result: OVERVALUED

P/S ratios tell one story, but what if the real opportunity lies elsewhere? Start investing in legacies, not executives. Discover our 18 top founder-led companies.
Upgrade Your Decision Making: Choose your Daqo New Energy Narrative
Earlier the article mentioned that there is an even better way to understand valuation. Narratives help you add a clear story about Daqo New Energy on top of the numbers by linking your view of its future revenue, earnings and margins to a forecast and then to a fair value that you can compare with the current share price.
On Simply Wall St's Community page, Narratives are an easy tool that lets you see and create these stories so you can judge for yourself whether a fair value such as the consensus US$31.86, a more optimistic US$39.00 or a more cautious US$15.60 fits better with what you believe about polysilicon demand, industry reform and Daqo New Energy's cost control and technology plans.
Because Narratives update when new earnings, news or guidance arrive, you can quickly see how a change in expected revenue growth, profit margins or future P/E feeds through to fair value. You can then use that to decide whether the gap between your fair value and the live price suggests waiting, building a position slowly or trimming exposure.
For Daqo New Energy however we will make it really easy for you with previews of two leading Daqo New Energy Narratives:
Start with a bullish skewed view that leans on cost control, technology and industry reform.
Fair value in this bullish narrative: US$31.86 per share.
Discount to this fair value at the last close of US$19.14: about 39.9%.
Assumed annual revenue growth: 27.47%.
- Analysts in this camp focus on regulatory efforts in China aimed at curbing irrational competition and supporting sales above production costs, which they see as helpful for stabilising polysilicon pricing and protecting margins.
- They highlight Daqo New Energy's work on N type polysilicon and ongoing cost reduction efforts, combined with a debt free balance sheet and sizeable cash, as important supports for future earnings quality.
- A consensus price target of US$31.86 is built on forecasts for revenue of about US$1.4b and earnings of US$163.1m by 2029, with a P/E of 19.0x and a discount rate of about 11.6%.
Then compare that with a more cautious view that leans on oversupply risks and more conservative valuation multiples.
Fair value in this bearish narrative: US$15.60 per share.
Premium to this fair value at the last close of US$19.14: about 22.7%.
Assumed annual revenue growth: 30.46%.
- The bearish cohort emphasises the risk that capacity rationalisation and new low cost projects could re create heavy oversupply, which may keep polysilicon prices and Daqo New Energy's margins under pressure.
- They point to the possibility that higher reinvestment needs, including digitalisation and capacity upgrades, consume a large portion of the US$2.21b cash and liquid assets, which could limit future flexibility and returns.
- This view anchors on a fair value of US$15.60, based on earnings of US$208.7m, a P/E of 7.1x and an 11.4% discount rate, and sits well below both the current share price and the more optimistic analyst targets.
These two narratives give you a clear range of outcomes to stress test against your own expectations for Daqo New Energy's volumes, pricing, margins and capital allocation. Once you know which set of assumptions feels closer to your view, you can decide how closely the current market price lines up with your preferred story.To see how these results tie into long-term growth, risks, and valuation, check out the full range of community narratives for Daqo New Energy on Simply Wall St. Add the company to your watchlist or portfolio so you'll be alerted when the story evolves.
Do you think there's more to the story for Daqo New Energy? Head over to our Community to see what others are saying!

This article by Simply Wall St is general in nature. We provide commentary based on historical data and analyst forecasts only using an unbiased methodology and our articles are not intended to be financial advice. It does not constitute a recommendation to buy or sell any stock, and does not take account of your objectives, or your financial situation. We aim to bring you long-term focused analysis driven by fundamental data. Note that our analysis may not factor in the latest price-sensitive company announcements or qualitative material. Simply Wall St has no position in any stocks mentioned.
Have feedback on this article? Concerned about the content? Get in touch with us directly. Alternatively, email editorial-team@simplywallst.com