
- LIVE QUOTES
- LEARN
- HELP


EN
Assessing ASML Holding (NasdaqGS:ASML) Valuation After Strong Share Price Momentum
Why ASML Holding (NasdaqGS:ASML) is Back on Investors’ Radar
ASML Holding (NasdaqGS:ASML) has attracted renewed attention after a strong 1 year total return of 123%, alongside reported annual revenue of €32,667.3m and net income of €9,609.4m. These figures highlight its role in semiconductor equipment.
See our latest analysis for ASML Holding.
ASML Holding’s share price is up 12.23% over the past week and 16.05% over the past 90 days, with a 27.02% year to date share price return and a 122.68% 1 year total shareholder return, pointing to strong recent momentum.
If ASML’s run has you thinking about what else is moving in chipmaking and automation, it could be a good moment to scan 33 robotics and automation stocks
With ASML posting €32,667.3m in revenue, €9,609.4m in net income and a market value around US$573.9b, plus a value score of 1 and an intrinsic value premium, is there still a buying opportunity here, or is the market already pricing in future growth?
Preferred P/E of 50.9x: Is it justified?
ASML is trading on a P/E of 50.9x, which is higher than the US semiconductor industry average of 41.3x but below the peer group average of 61.8x, so the market is assigning a premium price to its current earnings.
The P/E multiple tells you how much investors are paying for each dollar of earnings, and for a company like ASML, that price often reflects expectations around its role in high end semiconductor equipment and its earnings profile rather than just the latest results.
On one side, the stock looks expensive compared with the estimated fair P/E of 35.4x. This points to a valuation above the level that regression based fair value work suggests the market could move toward over time. On the other side, that premium sits below the 61.8x peer average. ASML shows earnings growth of 26.9% over the past year, forecast earnings growth of 16% per year, an outstanding 49% return on equity and high quality earnings, so some investors may view the richer P/E as a reflection of those characteristics rather than an extreme outlier.
Explore the SWS fair ratio for ASML Holding
Result: Price-to-earnings of 50.9x (OVERVALUED)
However, the rich P/E and intrinsic value premium could be vulnerable if demand for high end equipment softens or if export and geopolitical rules tighten further.
Find out about the key risks to this ASML Holding narrative.
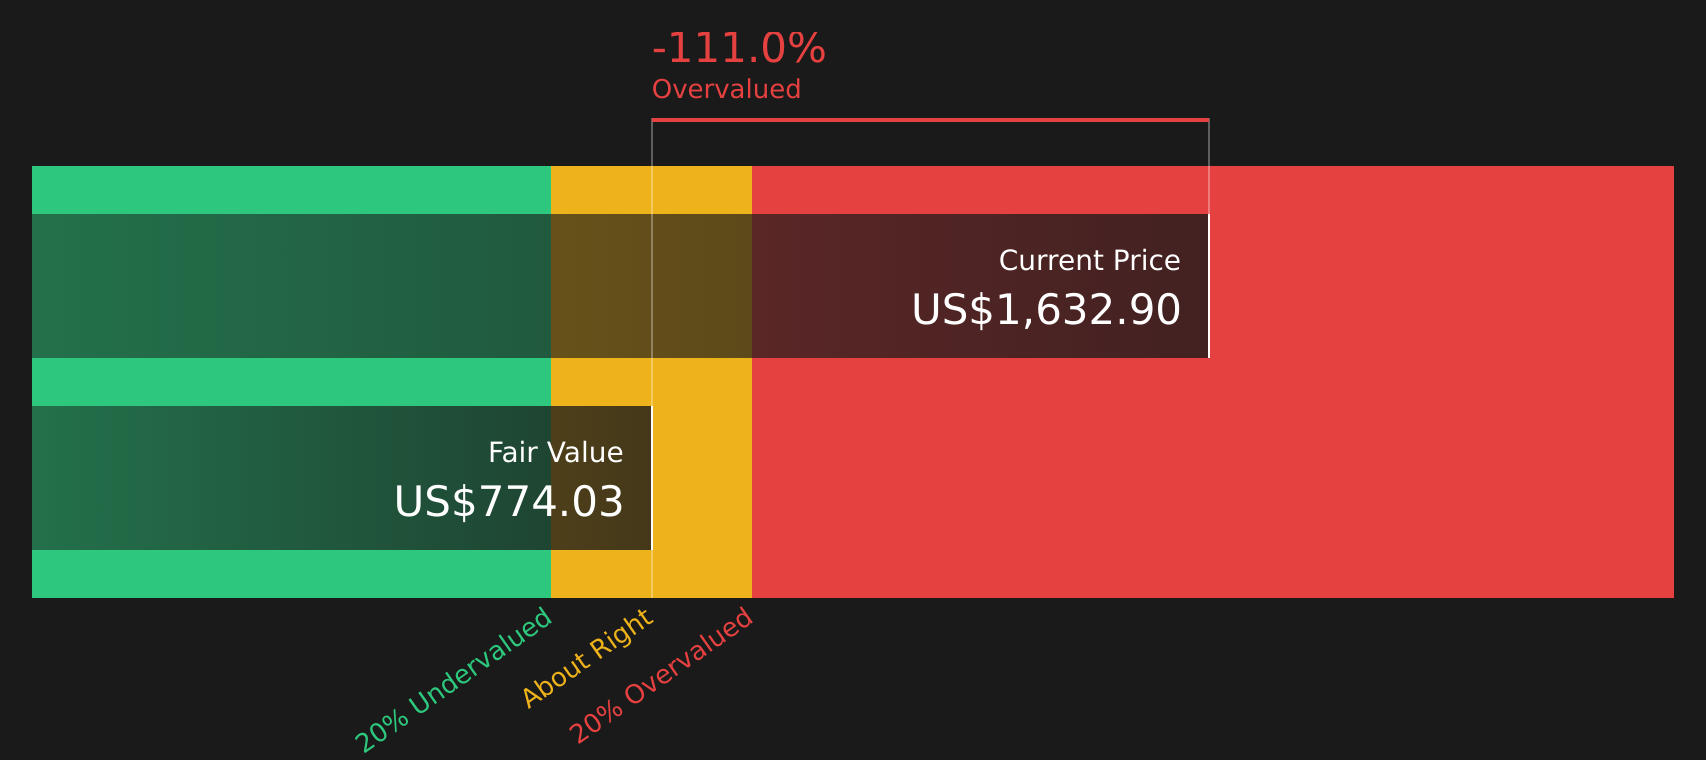
Another View: Cash Flows Paint a Harsher Picture
While the 50.9x P/E suggests a rich but possibly explainable price, the SWS DCF model is less forgiving. With ASML at $1,478.28 versus an estimated future cash flow value of $774.52, this approach points to the shares looking overvalued. This raises the question: which lens should you trust?
Look into how the SWS DCF model arrives at its fair value.
Simply Wall St performs a discounted cash flow (DCF) on every stock in the world every day (check out ASML Holding for example). We show the entire calculation in full. You can track the result in your watchlist or portfolio and be alerted when this changes, or use our stock screener to discover 58 high quality undervalued stocks. If you save a screener we even alert you when new companies match - so you never miss a potential opportunity.
Next Steps
If this combination of strong returns and valuation questions leaves you unsure, treat it as a prompt to review the numbers yourself and then move quickly. To see what the market currently views as the main upsides, have a look at the 2 key rewards
Looking for more investment ideas?
If ASML has your attention, do not stop here. Broaden your watchlist now so you are not catching up when the next big move is already underway.
- Target quality at a discount by scanning 58 high quality undervalued stocks that combine solid fundamentals with prices that may not fully reflect their underlying strength.
- Strengthen your income stream by reviewing 11 dividend fortresses that aim to pair higher yields with more resilient payouts.
- Focus on resilience first by checking 72 resilient stocks with low risk scores that score well on stability so short term swings are less likely to knock your plan off track.
This article by Simply Wall St is general in nature. We provide commentary based on historical data and analyst forecasts only using an unbiased methodology and our articles are not intended to be financial advice. It does not constitute a recommendation to buy or sell any stock, and does not take account of your objectives, or your financial situation. We aim to bring you long-term focused analysis driven by fundamental data. Note that our analysis may not factor in the latest price-sensitive company announcements or qualitative material. Simply Wall St has no position in any stocks mentioned.
Have feedback on this article? Concerned about the content? Get in touch with us directly. Alternatively, email editorial-team@simplywallst.com