
- LIVE QUOTES
- LEARN
- HELP


EN
Is It Too Late To Consider Argan (AGX) After Its 345% One-Year Surge?
- If you are wondering whether Argan’s share price still offers value after a strong run, or if you might be late to the story, this article will help you frame that question clearly.
- Argan’s stock last closed at US$609.29, with reported returns of 5.9% over 7 days, 32.8% over 30 days, 86.9% year to date and 345.0% over 1 year, while the 3 year figure is very large at 7x or more and the 5 year return is also very large.
- Recent coverage has focused on Argan’s share price performance and what it may imply about expectations for the company, as those return figures have drawn more attention to the stock. That conversation has naturally shifted toward whether the current price still lines up with what the business may be worth.
- According to Simply Wall St’s valuation checks, Argan currently scores 0 out of 6 on its valuation score. The rest of this article will compare several valuation approaches to see what they imply and then finish with a broader way to think about what “fair value” really means for you.
Argan scores just 0/6 on our valuation checks. See what other red flags we found in the full valuation breakdown.
Approach 1: Argan Discounted Cash Flow (DCF) Analysis
A Discounted Cash Flow, or DCF, model takes estimates of a company’s future cash flows and discounts them back to today’s dollars to arrive at an implied value per share. It is essentially asking what all those future cash flows are worth right now.
For Argan, Simply Wall St uses a 2 Stage Free Cash Flow to Equity model based on cash flow projections. The latest reported free cash flow is about $409.5 million. Analyst estimates and extrapolations then map out ten year free cash flow projections, with figures such as $240.53 million in 2026 and $263.37 million in 2035, which are then discounted at an appropriate rate to reflect risk and the time value of money.
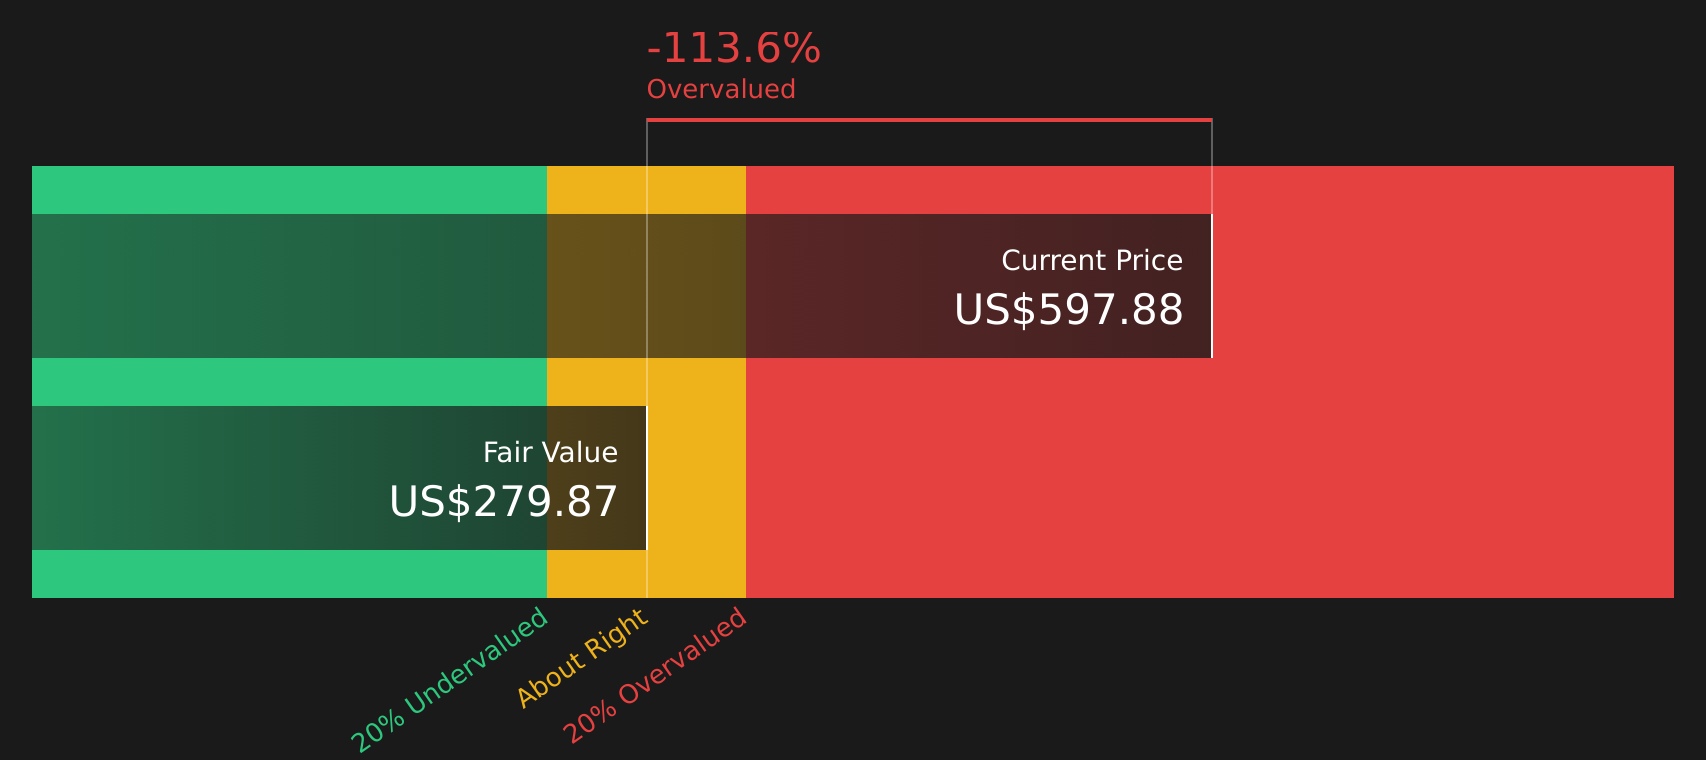
Pulling all of that together, the model produces an estimated intrinsic value of about $281.06 per share. Compared with the recent share price of US$609.29, this implies the stock is 116.8% above the DCF estimate, so on this model Argan screens as clearly overvalued.
Result: OVERVALUED
Our Discounted Cash Flow (DCF) analysis suggests Argan may be overvalued by 116.8%. Discover 62 high quality undervalued stocks or create your own screener to find better value opportunities.
Approach 2: Argan Price vs Earnings (P/E)
For profitable companies, the P/E ratio is a useful way to connect what you are paying for each share with the earnings that support that price. It tells you how many dollars investors are currently willing to pay for each dollar of earnings.
What counts as a “normal” or “fair” P/E depends on how the market views a company’s growth prospects and risk. Higher expected growth or lower perceived risk can justify a higher P/E, while lower growth expectations or higher risk usually point to a lower P/E.
Argan’s current P/E is 61.67x. That sits above the Construction industry average P/E of 37.16x and also above the peer group average of 37.82x, which suggests investors are paying a premium compared with both the broader industry and closer peers.
Simply Wall St’s Fair Ratio for Argan is 39.66x. This proprietary metric estimates what P/E might make sense given factors such as earnings growth, profit margins, industry, market cap and company specific risks. Because it pulls these inputs together in one place, it can give a more tailored view than a simple comparison to industry or peer averages.
Comparing the Fair Ratio of 39.66x with the actual P/E of 61.67x, Argan screens as trading above that fair value estimate.
Result: OVERVALUED

P/E ratios tell one story, but what if the real opportunity lies elsewhere? Start investing in legacies, not executives. Discover our 19 top founder-led companies.
Upgrade Your Decision Making: Choose your Argan Narrative
Earlier it was mentioned that there is an even better way to understand valuation, so this is where Narratives come in as a simple way for you to attach a clear story about Argan to the numbers around fair value, future revenue, earnings and margins.
A Narrative on Simply Wall St is your structured view of a company that links what you believe about its business, industry drivers and risks to a financial forecast and then to a fair value estimate, instead of looking at ratios like the P/E in isolation.
On the Community page, where millions of investors share their views, Narratives are available as an accessible tool that lets you compare a Fair Value from your story with the current share price to help you decide whether Argan looks expensive, cheap or roughly in line with your expectations.
These Narratives update automatically when fresh information such as Argan’s earnings, backlog disclosures or analyst targets is added, so your fair value view stays in sync with the latest data rather than going stale.
For Argan, one investor might build a Narrative closer to the higher US$550 analyst fair value, leaning on the more optimistic revenue and margin assumptions. Another might anchor on the lower US$375 view, placing more weight on gas exposure and project risk. Both can see clearly how their story translates into a number versus the current US$609.29 share price.
Do you think there's more to the story for Argan? Head over to our Community to see what others are saying!

This article by Simply Wall St is general in nature. We provide commentary based on historical data and analyst forecasts only using an unbiased methodology and our articles are not intended to be financial advice. It does not constitute a recommendation to buy or sell any stock, and does not take account of your objectives, or your financial situation. We aim to bring you long-term focused analysis driven by fundamental data. Note that our analysis may not factor in the latest price-sensitive company announcements or qualitative material. Simply Wall St has no position in any stocks mentioned.
Have feedback on this article? Concerned about the content? Get in touch with us directly. Alternatively, email editorial-team@simplywallst.com