
- LIVE QUOTES
- LEARN
- HELP


EN
Is It Time To Revisit NXP Semiconductors (NXPI) After Recent Price Swings?
- If you are wondering whether NXP Semiconductors at around US$205.67 is still offering value or already pricing in a lot of optimism, you are asking the right question.
- The stock has returned 5.7% over the last 7 days, 1.3% over the past month, a 7.1% decline year to date, and 26.6% over the last year. These figures give mixed signals about how the market is currently treating the shares.
- Recent coverage has focused on NXP Semiconductors' position in the wider semiconductor space and how investors are weighing long term demand for its products against shorter term sentiment shifts. This backdrop helps explain why the price has moved in different directions over shorter and longer time frames, even though the same business is being valued.
- NXP Semiconductors currently has a valuation score of 5/6. The next sections will break that down across standard approaches like DCF and multiples, before finishing with a way to think about valuation that can give you a more complete picture.
Find out why NXP Semiconductors's 26.6% return over the last year is lagging behind its peers.
Approach 1: NXP Semiconductors Discounted Cash Flow (DCF) Analysis
The Discounted Cash Flow model estimates what a business might be worth by projecting its future cash flows and discounting them back to today’s value. It aims to answer what those future dollars are worth in your hands right now.
For NXP Semiconductors, the latest twelve month Free Cash Flow is about US$2.0b. Using a 2 Stage Free Cash Flow to Equity model, analysts provide explicit cash flow estimates out to 2030. Simply Wall St then extrapolates further years based on those inputs. Under this framework, projected Free Cash Flow reaches about US$4.9b in 2030, with additional estimates extending through 2035.
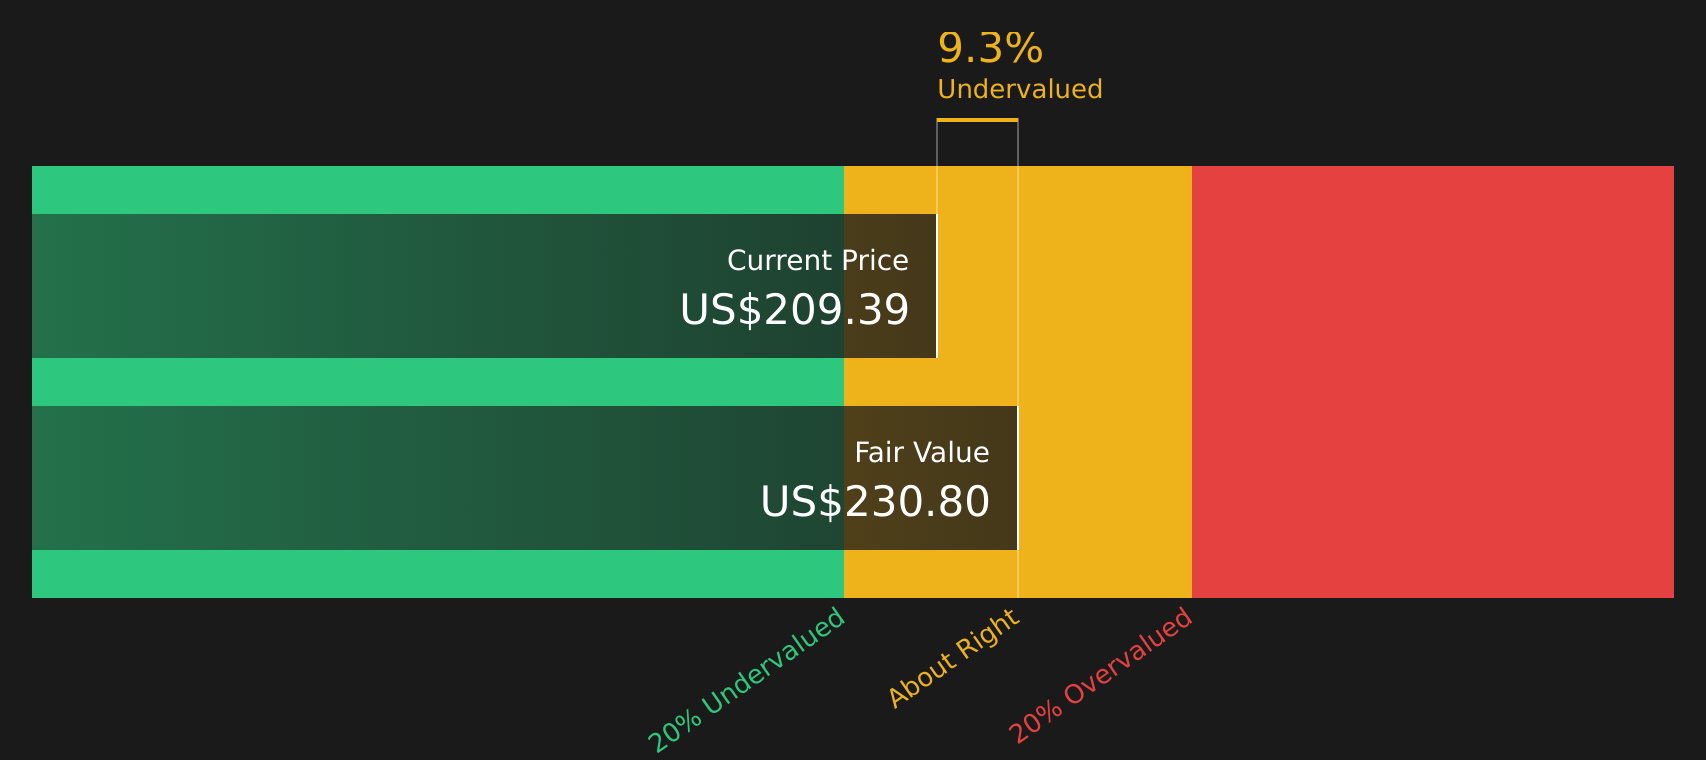
When all those projected cash flows are discounted back, the intrinsic value for NXP Semiconductors is approximately US$230.37 per share. Compared with a recent share price around US$205.67, this difference suggests the stock is trading at about a 10.7% discount to that estimate, indicating that the shares are mildly undervalued according to this model.
Result: UNDERVALUED
Our Discounted Cash Flow (DCF) analysis suggests NXP Semiconductors is undervalued by 10.7%. Track this in your watchlist or portfolio, or discover 62 more high quality undervalued stocks.
Approach 2: NXP Semiconductors Price vs Earnings
For a profitable company, the P/E ratio is a straightforward way to connect what you are paying today with the earnings the business is already generating. It lets you quickly see how much investors are currently willing to pay for each dollar of earnings.
What counts as a “normal” P/E often reflects how the market views a company’s growth potential and risk. Companies with stronger expected growth or lower perceived risk usually trade on higher P/E multiples, while slower growing or riskier businesses tend to command lower ones.
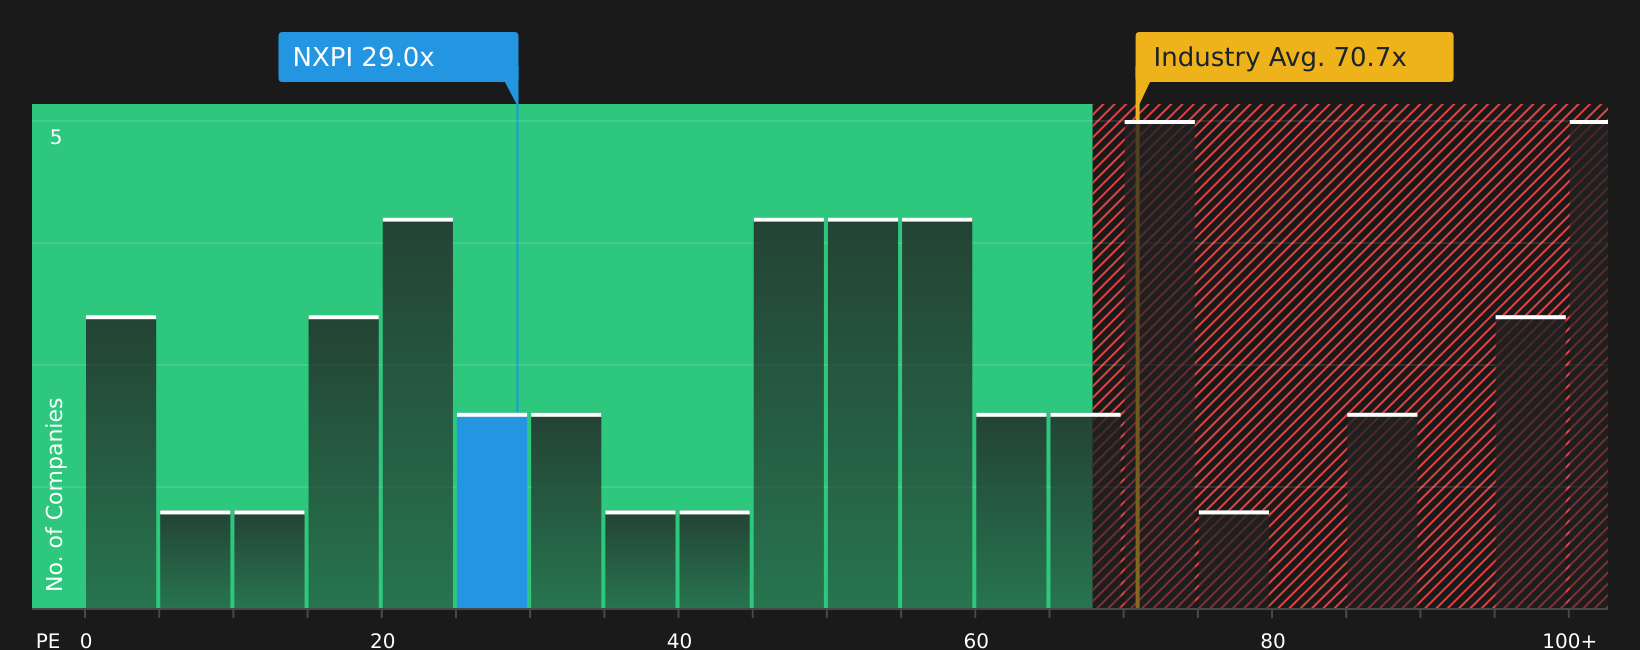
NXP Semiconductors currently trades on a P/E of 25.72x, compared with the Semiconductor industry average of about 39.82x and a peer group average of 69.84x. Simply Wall St’s Fair Ratio for the stock is 27.17x, which is its proprietary view of what a suitable P/E might be given factors such as earnings growth profile, profit margins, industry, market cap and risks.
Because the Fair Ratio incorporates these company specific factors, it can be more tailored than a simple comparison to industry or peer averages. Against this Fair Ratio of 27.17x, NXP Semiconductors’ current P/E of 25.72x suggests the shares are modestly undervalued on this metric.
Result: UNDERVALUED
P/E ratios tell one story, but what if the real opportunity lies elsewhere? Start investing in legacies, not executives. Discover our 19 top founder-led companies.
Upgrade Your Decision Making: Choose your NXP Semiconductors Narrative
Earlier it was mentioned that there is an even better way to understand valuation. Narratives are introduced here as simple stories you choose about NXP Semiconductors that connect your view of its business to a set of revenue, earnings and margin assumptions. These then flow into a Fair Value that you can compare with the current price on Simply Wall St’s Community page. Narratives are updated automatically when new news or earnings arrive. One investor might back a more optimistic NXP view with a Fair Value around US$305.82 based on faster growth and higher margins, while another might prefer a cautious stance closer to US$174.04, and others may sit around the consensus near US$261.33, all using the same tool to decide whether the current price looks high, low or about right for their chosen story.
Do you think there's more to the story for NXP Semiconductors? Head over to our Community to see what others are saying!

This article by Simply Wall St is general in nature. We provide commentary based on historical data and analyst forecasts only using an unbiased methodology and our articles are not intended to be financial advice. It does not constitute a recommendation to buy or sell any stock, and does not take account of your objectives, or your financial situation. We aim to bring you long-term focused analysis driven by fundamental data. Note that our analysis may not factor in the latest price-sensitive company announcements or qualitative material. Simply Wall St has no position in any stocks mentioned.
Have feedback on this article? Concerned about the content? Get in touch with us directly. Alternatively, email editorial-team@simplywallst.com