
- LIVE QUOTES
- LEARN
- HELP


EN
Has Merck (MRK) Already Done The Heavy Lifting After A 56% One-Year Rally?
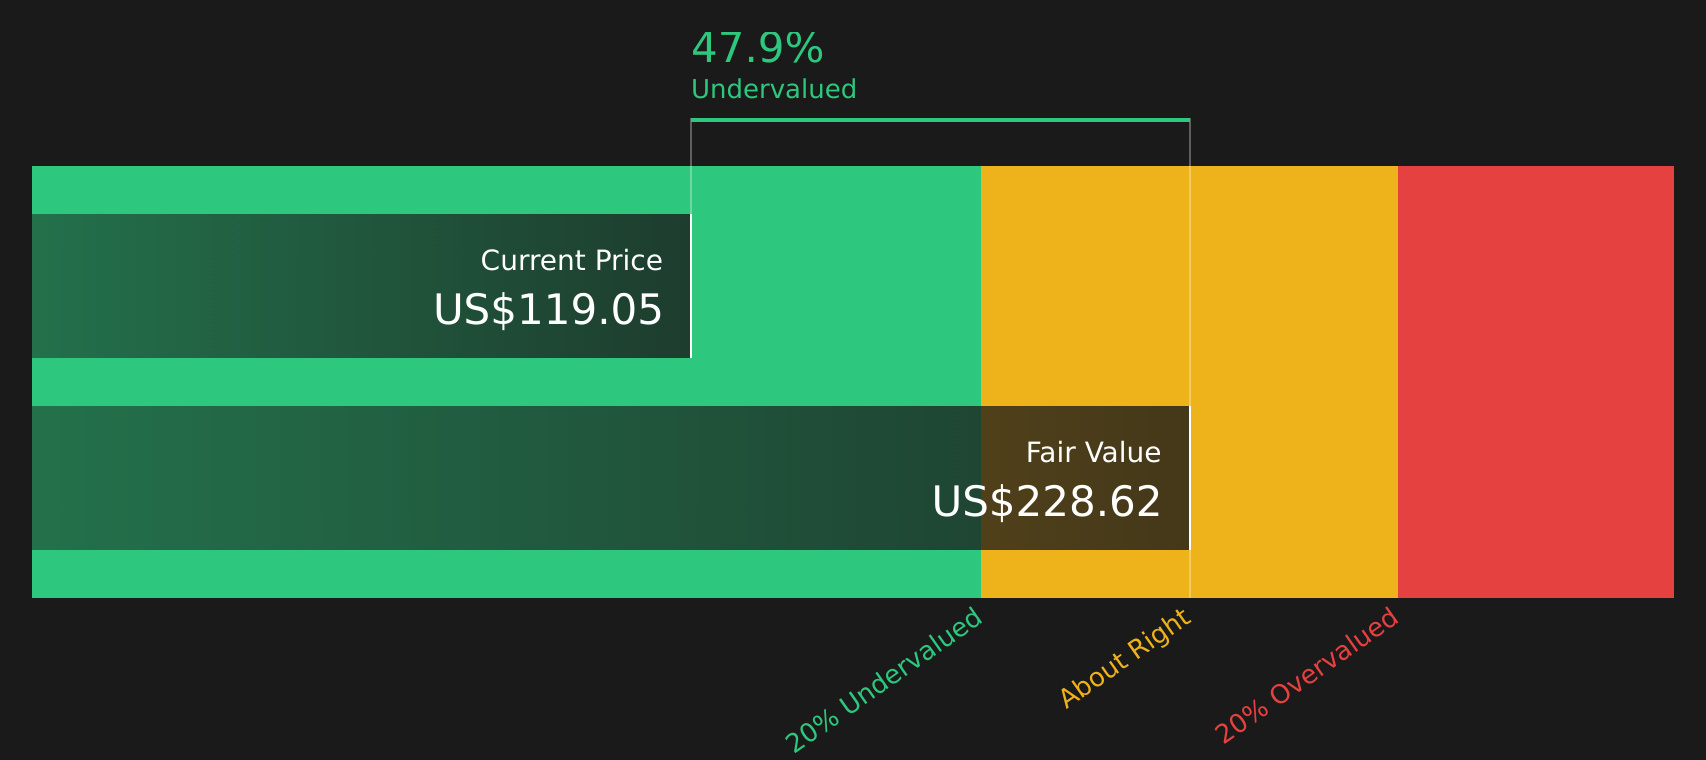
- If you are wondering whether Merck at around US$123 per share still offers value or has already done the heavy lifting, you are asking the right question.
- The stock has recent returns of 1.9% over 7 days, 5.2% over 30 days, 15.7% year to date and 55.8% over 1 year, which naturally puts valuation front and center for anyone looking at the name today.
- Recent coverage has focused on Merck's position in US pharmaceuticals and biotech, highlighting how investors are weighing its pipeline, patent profile and capital allocation against broader sector conditions. That context helps explain why the market is paying close attention to how much is already reflected in the current share price.
- On Simply Wall St's 6 point valuation framework, Merck scores a 4. This suggests several checks flag it as undervalued. The next step is to look at the different valuation methods behind that score, then finish with an approach that can help you connect those numbers to the bigger picture of Merck's story.
Approach 1: Merck Discounted Cash Flow (DCF) Analysis
A Discounted Cash Flow, or DCF, model estimates what a company might be worth by projecting future cash flows and discounting them back to today to reflect risk and the time value of money.
For Merck, the model uses a 2 Stage Free Cash Flow to Equity approach. The latest twelve month free cash flow is about $12.6b. Analyst estimates and Simply Wall St extrapolations project free cash flow reaching around $22.1b in 2030, with a full set of forecasts running from 2026 through 2035. These projected cash flows are then discounted back to today in dollar terms to arrive at an equity value per share.
On this basis, the DCF model estimates Merck’s intrinsic value at about $200.85 per share. Compared with the recent share price around $123, the model implies a discount of roughly 38.7%, which points to the shares trading below this estimate of underlying value.
Result: UNDERVALUED
Our Discounted Cash Flow (DCF) analysis suggests Merck is undervalued by 38.7%. Track this in your watchlist or portfolio, or discover 63 more high quality undervalued stocks.
Approach 2: Merck Price vs Earnings
For a profitable company like Merck, the P/E ratio is a useful shorthand for what investors are currently willing to pay for each dollar of earnings. It lets you compare what the market is pricing in for Merck’s earnings power versus other companies using a single, consistent yardstick.
What counts as a “normal” or “fair” P/E usually reflects how the market views a company’s growth prospects and risks. Higher expected growth or perceived resilience can justify a higher P/E, while more uncertainty or lower growth can point to a lower multiple being appropriate.
Merck currently trades on a P/E of 16.7x. That is close to the broader Pharmaceuticals industry average of 16.5x, and sits below the peer group average of 25.1x. Simply Wall St’s Fair Ratio for Merck is 28.2x, which is its proprietary estimate of what a suitable P/E could be after factoring in elements such as earnings growth, profit margins, industry, market cap and risk profile. This Fair Ratio aims to be more tailored than a simple comparison to peers or the industry, because it adjusts for company specific characteristics rather than relying on broad group averages alone. With Merck’s actual P/E of 16.7x below the 28.2x Fair Ratio, this approach suggests the shares may be undervalued on an earnings multiple basis.
Result: UNDERVALUED

P/E ratios tell one story, but what if the real opportunity lies elsewhere? Start investing in legacies, not executives. Discover our 19 top founder-led companies.
Upgrade Your Decision Making: Choose your Merck Narrative
Earlier it was mentioned that there is an even better way to understand valuation. Narratives on Simply Wall St’s Community page give you a clear story behind your numbers by linking your view of Merck’s pipeline, patent risks and margins to a concrete forecast and Fair Value. You can compare this with today’s price, have it update automatically when new news or earnings arrive, and tailor it to your own stance, whether you lean closer to a cautious Merck view with an assumed Fair Value around US$101.30 or a more optimistic view closer to US$150.00, rather than relying only on a single P/E or DCF output.
For Merck however we'll make it really easy for you with previews of two leading Merck Narratives:
Both are built off the same core data, but they reach different conclusions about how much of the story is already in the current price. Reading them side by side can help you decide which set of assumptions feels closer to your own view on product launches, patent risks and policy changes.
Fair value: US$124.88
Gap to fair value vs last close: 1.4% discount using the narrative fair value.
Revenue growth assumption: 4.8% a year.
- Sees value in Merck nearly tripling its late phase pipeline since 2021, with over 20 potential growth drivers and a commercial opportunity that analysts size at more than US$50b by the mid 2030s.
- Builds in higher earnings and margin assumptions, including revenue growth of around 4.2% a year in the near term, rising profit margins and a future P/E of 12.3x on 2028 earnings.
- Flags real risks around Gardasil demand, tariffs, competition and the eventual KEYTRUDA loss of exclusivity, but still concludes that the combined pipeline and investment plans support a higher value than today’s share price.
Fair value: US$112.55
Gap to fair value vs last close: 9.4% premium using the narrative fair value.
Revenue growth assumption: 5.3% a year.
- Emphasises how much of Merck’s current position is tied to KEYTRUDA and frames the 2028 patent expiry as a key risk if replacement products do not scale quickly enough.
- Highlights regulatory complexity, stronger competition from other large pharma names and the potential for profit guidance changes to drive swings in sentiment.
- Argues that while Merck has strengths in oncology, vaccines, R&D and global reach, the current valuation already reflects much of that and leaves less room for disappointment.
If you want to see how other investors are weighing these trade offs, including different views on KEYTRUDA, Gardasil and the late stage pipeline, it is worth reading the full narratives alongside the latest data and community updates for Merck, then stress testing which assumptions you are most comfortable with before making any decision.
See what the community is saying about Merck
Do you think there's more to the story for Merck? Head over to our Community to see what others are saying!

This article by Simply Wall St is general in nature. We provide commentary based on historical data and analyst forecasts only using an unbiased methodology and our articles are not intended to be financial advice. It does not constitute a recommendation to buy or sell any stock, and does not take account of your objectives, or your financial situation. We aim to bring you long-term focused analysis driven by fundamental data. Note that our analysis may not factor in the latest price-sensitive company announcements or qualitative material. Simply Wall St has no position in any stocks mentioned.
Have feedback on this article? Concerned about the content? Get in touch with us directly. Alternatively, email editorial-team@simplywallst.com