
- LIVE QUOTES
- LEARN
- HELP


EN
Is It Too Late To Consider DuPont de Nemours (DD) After A 101% One Year Surge?
- Wondering if DuPont de Nemours is still reasonably priced after a strong run, or if the easy gains are behind it? This article walks through the numbers so you can judge the value case for yourself.
- At a last close of US$45.53, the stock has posted a 0.6% move over the past month, 11.4% year to date, and 101.5% over the past year. A 0.6% decline over the last 7 days may hint that expectations and risk perceptions are shifting.
- Recent headlines have focused on DuPont de Nemours as a materials and chemicals player, highlighting how broader sector sentiment and company specific developments can influence trading activity. This mix of attention and changing expectations helps explain why returns over 1, 3 and 5 years are part of the current valuation debate.
- On Simply Wall St’s 6 point valuation checklist, DuPont de Nemours scores 4 out of 6. This sets up a closer look at how metrics like P/E, P/S and discounted cash flow line up today, and hints at an even richer way to think about valuation that will be covered at the end of this article.
Find out why DuPont de Nemours's 101.5% return over the last year is lagging behind its peers.
Approach 1: DuPont de Nemours Discounted Cash Flow (DCF) Analysis
A DCF model takes estimates of future cash flows, then discounts them back to what they could be worth today, using a required rate of return. It is essentially asking what a stream of future cash flows might be worth in today’s dollars.
For DuPont de Nemours, the model used is a 2 Stage Free Cash Flow to Equity approach, based on cash flow projections. The latest twelve month Free Cash Flow is about $1.09b. Analysts provide free cash flow estimates out to 2029, with Simply Wall St extrapolating further out to 2035 using its own assumptions, so the ten year projections range from about $908.9m in 2026 to around $1.52b in 2035.
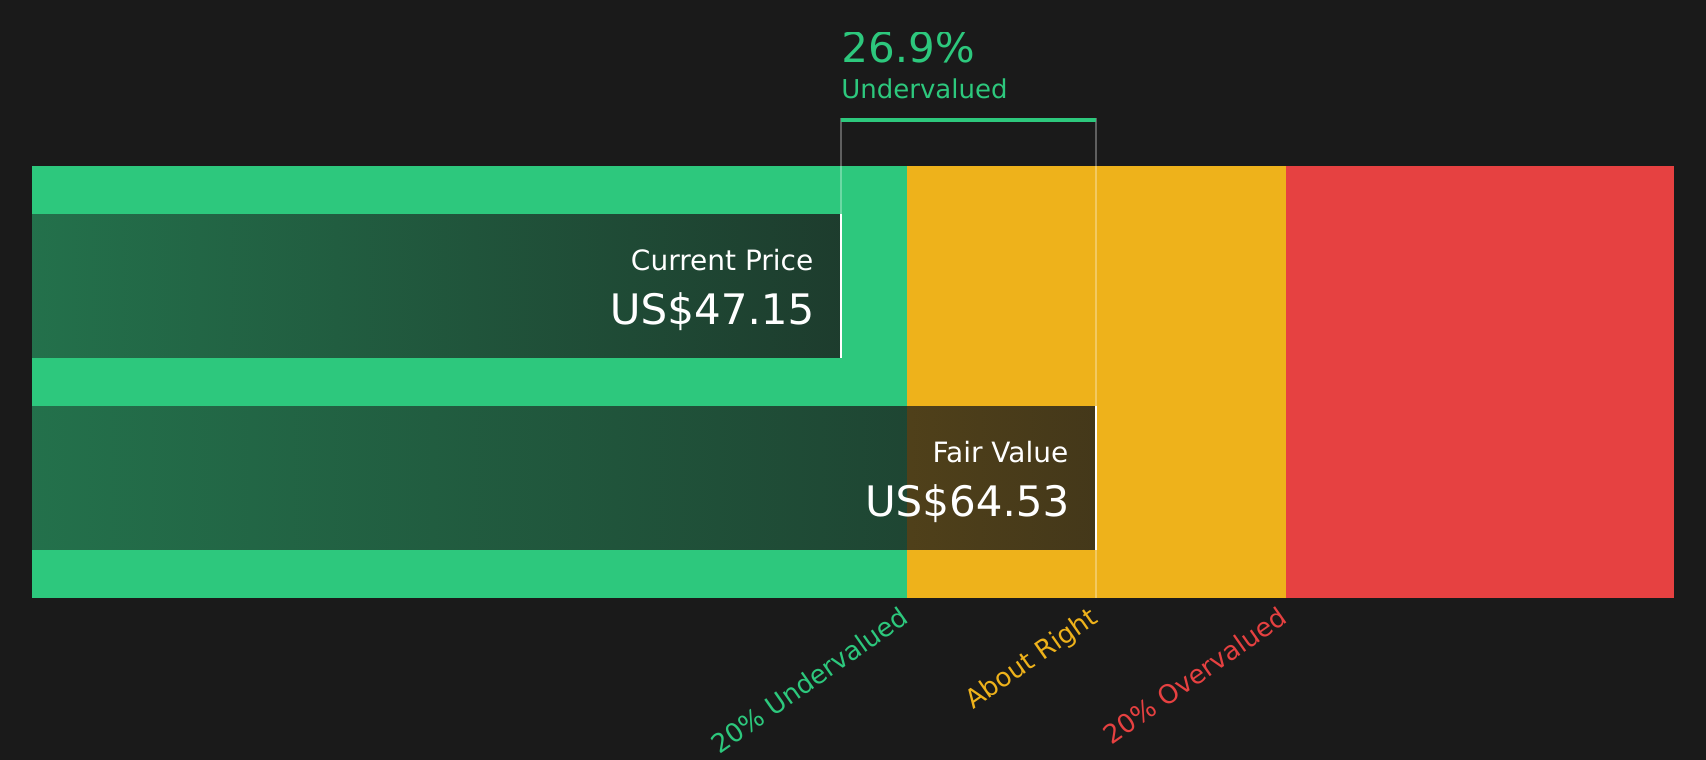
When all those projected cash flows are discounted back and combined, the DCF model arrives at an estimated intrinsic value of about $64.89 per share. Compared to the recent share price of $45.53, this implies a DCF discount of 29.8%, indicating that the shares are trading below this model’s estimate of value.
Result: UNDERVALUED
Our Discounted Cash Flow (DCF) analysis suggests DuPont de Nemours is undervalued by 29.8%. Track this in your watchlist or portfolio, or discover 61 more high quality undervalued stocks.
Approach 2: DuPont de Nemours Price vs Sales
For profitable companies that already generate meaningful revenue, the P/S ratio is a useful way to think about what investors are paying for each dollar of sales, especially when earnings are less informative or temporarily distorted.
Growth expectations and risk both matter here. Higher expected growth or lower perceived risk can justify a higher “normal” or “fair” P/S ratio, while slower expected growth or higher uncertainty usually points to a lower multiple being reasonable.
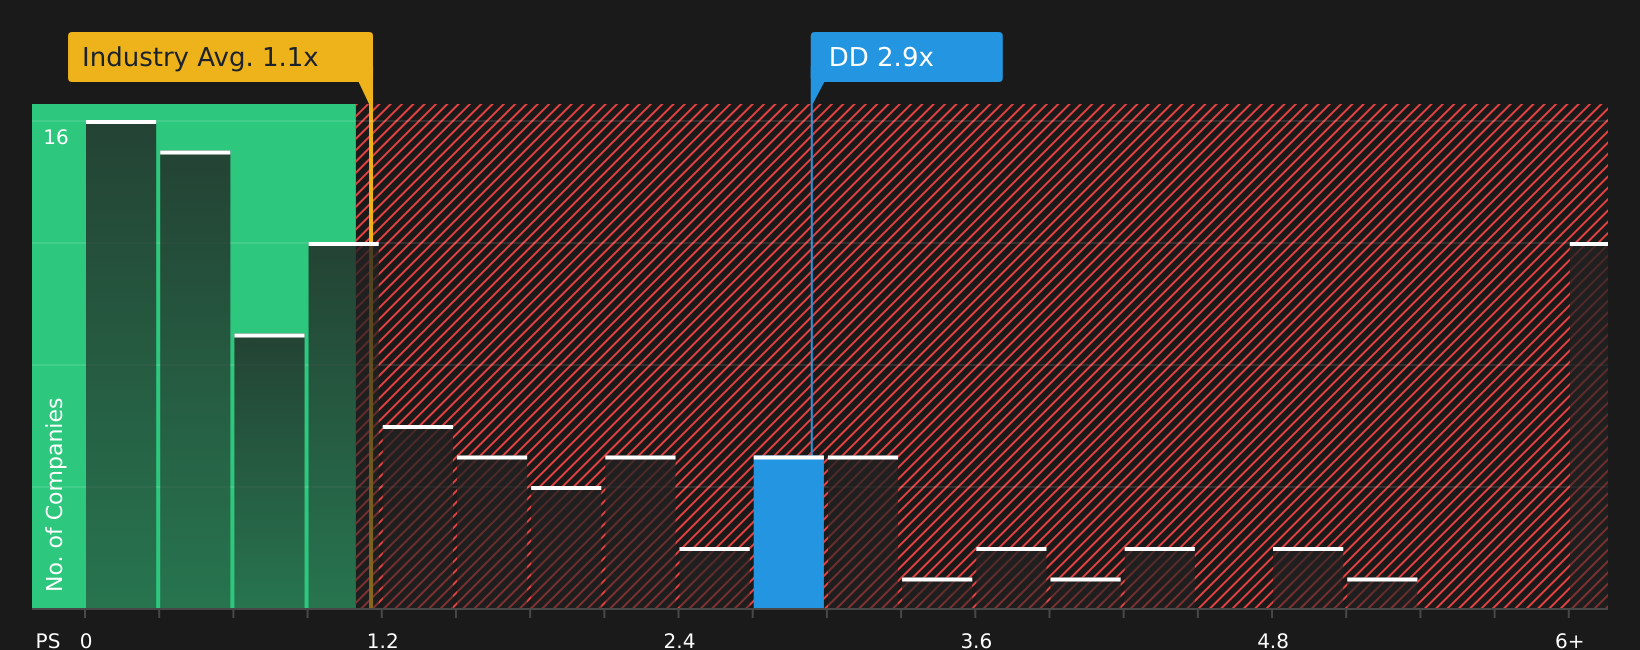
DuPont de Nemours currently trades on a P/S of 2.72x. That sits above the Chemicals industry average of 1.09x and also above the peer group average of 2.17x. Simply Wall St’s Fair Ratio for DuPont de Nemours is 2.93x, which is its proprietary estimate of what a suitable P/S might be given factors like the company’s earnings profile, industry, profit margins, market cap and key risks.
The Fair Ratio aims to be more tailored than a simple peer or industry comparison because it adjusts for growth, risk, profitability, sector and size, rather than assuming that all companies should trade on the same headline multiple.
Comparing the Fair Ratio of 2.93x with the current P/S of 2.72x suggests the shares are slightly below that modelled “fair” level.
Result: UNDERVALUED
P/S ratios tell one story, but what if the real opportunity lies elsewhere? Start investing in legacies, not executives. Discover our 18 top founder-led companies.
Upgrade Your Decision Making: Choose your DuPont de Nemours Narrative
Earlier it was mentioned that there is an even better way to understand valuation, so Narratives are introduced here as a simple story you choose about DuPont de Nemours that ties your view of its business to specific forecasts for revenue, earnings and margins, then into a Fair Value that you can compare with the current share price.
On Simply Wall St’s Community page, Narratives let you set out your own assumptions or align with existing ones, and then see in one place how that story translates into numbers. You can lean toward a cautious view closer to a Fair Value of US$50.00, a more upbeat view closer to US$64.00, or sit around the consensus view near US$56.13.
Because these Narratives refresh as new news, guidance or earnings arrive, you can quickly see whether the gap between Fair Value and the actual price still supports your investment thesis or suggests it may be time to reassess your stance on DuPont de Nemours.
Do you think there's more to the story for DuPont de Nemours? Head over to our Community to see what others are saying!

This article by Simply Wall St is general in nature. We provide commentary based on historical data and analyst forecasts only using an unbiased methodology and our articles are not intended to be financial advice. It does not constitute a recommendation to buy or sell any stock, and does not take account of your objectives, or your financial situation. We aim to bring you long-term focused analysis driven by fundamental data. Note that our analysis may not factor in the latest price-sensitive company announcements or qualitative material. Simply Wall St has no position in any stocks mentioned.
Have feedback on this article? Concerned about the content? Get in touch with us directly. Alternatively, email editorial-team@simplywallst.com