
- LIVE QUOTES
- LEARN
- HELP


EN
Is Credit Acceptance (CACC) Price Justified After Recent Share Rebound And Mixed Valuation Signals
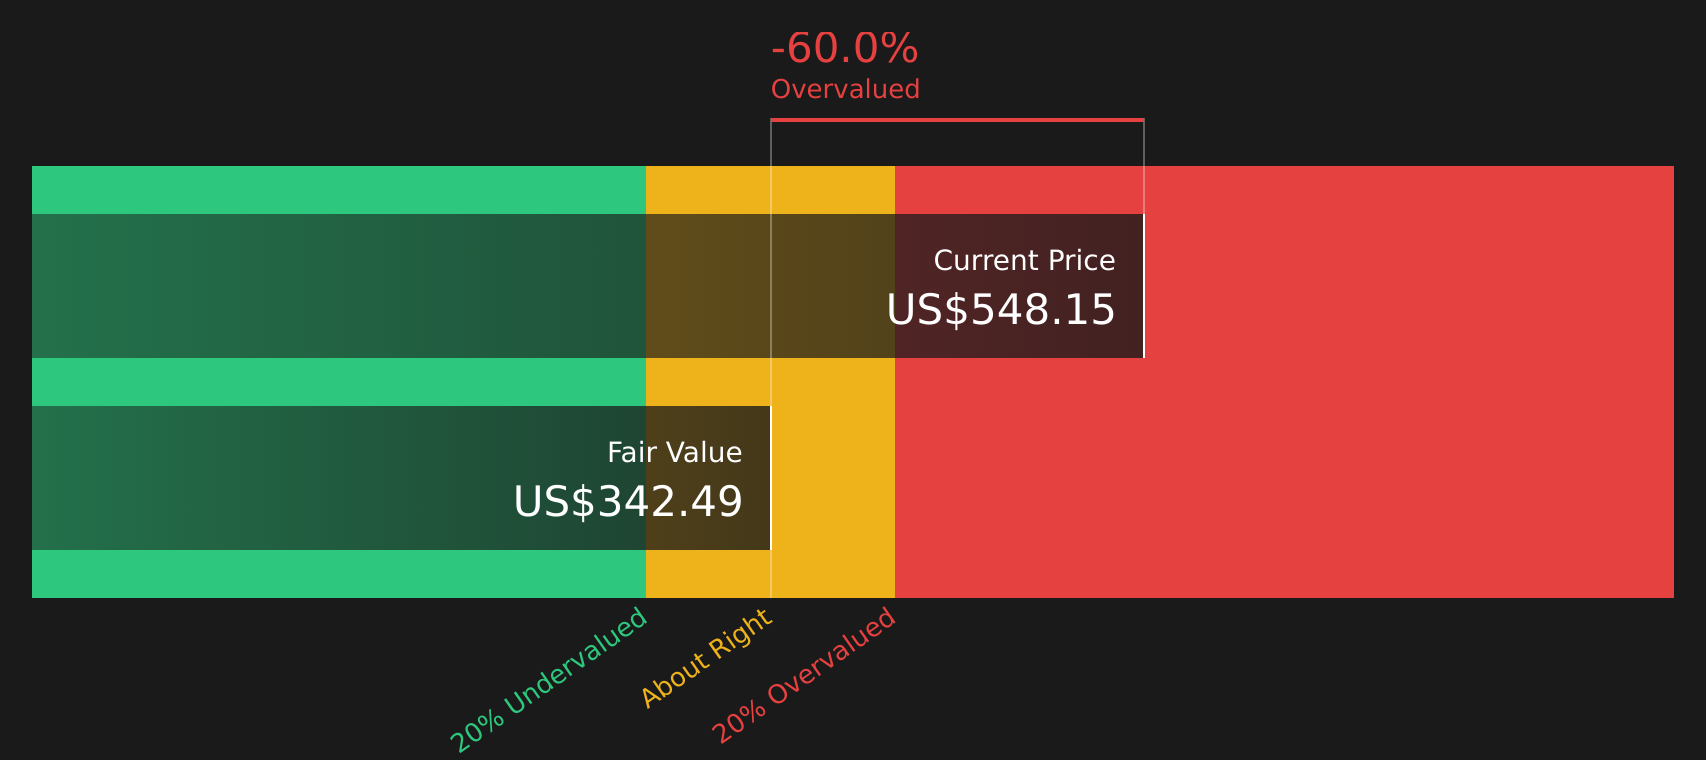
- If you are trying to work out whether Credit Acceptance at around US$444 per share looks expensive or offers value, the starting point is understanding what the current share price actually reflects.
- Over the last week the stock is up 5.0%, while the 1 year return sits at a 5.0% decline and the year to date move is a 2.0% decline, which hints that sentiment around risk and reward has shifted more than once recently.
- The share price moves sit against a backdrop of ongoing attention on consumer credit quality, funding conditions and regulators' views on auto lending. All of these factors feed directly into how investors think about Credit Acceptance, and they can quickly change how the market prices lenders, even when company specific headlines are limited.
- On Simply Wall St's valuation model, Credit Acceptance currently scores 1 out of 6 for potential undervaluation. The next step is a closer look at the different valuation methods behind that score and, before the end, a broader way to think about what the market might be missing.
Credit Acceptance scores just 1/6 on our valuation checks. See what other red flags we found in the full valuation breakdown.
Approach 1: Credit Acceptance Excess Returns Analysis
The Excess Returns model looks at how much profit a company is expected to generate above the return that equity investors require, then capitalizes those “excess” profits into a per share value.
For Credit Acceptance, the model uses a Book Value of about $142.66 per share and a Stable EPS of $26.37 per share, based on the median return on equity from the past 5 years. The implied Cost of Equity is $14.31 per share, which leaves an Excess Return of $12.06 per share. That is supported by an Average Return on Equity of 19.36% and a Stable Book Value assumption of $136.25 per share, taken from the median book value over the same period.
When these excess returns are projected and discounted, the Excess Returns Model arrives at an intrinsic value of roughly $306.25 per share. Compared with a market price around $444, this approach implies the shares are about 45.2% overvalued using this framework.
Result: OVERVALUED
Our Excess Returns analysis suggests Credit Acceptance may be overvalued by 45.2%. Discover 61 high quality undervalued stocks or create your own screener to find better value opportunities.
Approach 2: Credit Acceptance Price vs Earnings
For a profitable lender like Credit Acceptance, the P/E ratio is a practical way to think about value because it links what you pay directly to the earnings the business is currently generating. In simple terms, a higher P/E tends to reflect higher growth expectations or a perception of lower risk, while a lower P/E can point to more modest growth assumptions or higher perceived risk.
Credit Acceptance currently trades on a P/E of 11.28x. That sits above the Consumer Finance industry average of 8.27x and above the peer group average of 9.06x, so on simple comparisons the market is putting a higher earnings multiple on the stock than on many sector peers.
Simply Wall St also calculates a “Fair Ratio” of 12.14x, which is the P/E that might be expected given factors such as Credit Acceptance’s earnings profile, industry, profit margins, market capitalization and risk characteristics. This Fair Ratio can be more useful than a plain peer or industry comparison because it adjusts for those business specific factors rather than assuming all lenders should trade on the same multiple. With the current P/E of 11.28x sitting below the Fair Ratio of 12.14x, the shares screen as undervalued on this metric.
Result: UNDERVALUED

P/E ratios tell one story, but what if the real opportunity lies elsewhere? Start investing in legacies, not executives. Discover our 18 top founder-led companies.
Upgrade Your Decision Making: Choose your Credit Acceptance Narrative
Earlier it was mentioned that there is an even better way to think about valuation. Narratives are an approach where you attach a clear story about Credit Acceptance to your own numbers on future revenue, earnings and margins, link that story to a forecast and a fair value, and then compare that fair value with the current share price to decide whether the stock looks attractive or stretched.
On Simply Wall St, Narratives sit inside the Community page and are used by millions of investors as an accessible tool. The key benefit is that they update automatically as fresh information comes in, such as new earnings, analyst targets or news, so your story and valuation do not sit frozen while the world changes.
For Credit Acceptance, for example, one investor might build a Narrative close to the analyst consensus fair value of about US$451.67 per share with earnings reaching roughly US$360.3m by 2029 and a future P/E of 13.59x. Another might lean toward the much higher US$714 fair value from Citron Research. Those two Narratives lead to very different views when each fair value is stacked against the current market price.
Do you think there's more to the story for Credit Acceptance? Head over to our Community to see what others are saying!

This article by Simply Wall St is general in nature. We provide commentary based on historical data and analyst forecasts only using an unbiased methodology and our articles are not intended to be financial advice. It does not constitute a recommendation to buy or sell any stock, and does not take account of your objectives, or your financial situation. We aim to bring you long-term focused analysis driven by fundamental data. Note that our analysis may not factor in the latest price-sensitive company announcements or qualitative material. Simply Wall St has no position in any stocks mentioned.
Have feedback on this article? Concerned about the content? Get in touch with us directly. Alternatively, email editorial-team@simplywallst.com