
- LIVE QUOTES
- LEARN
- HELP


EN
Is It Too Late To Reassess Uniti Group (UNIT) After This Sharp Share Price Rally
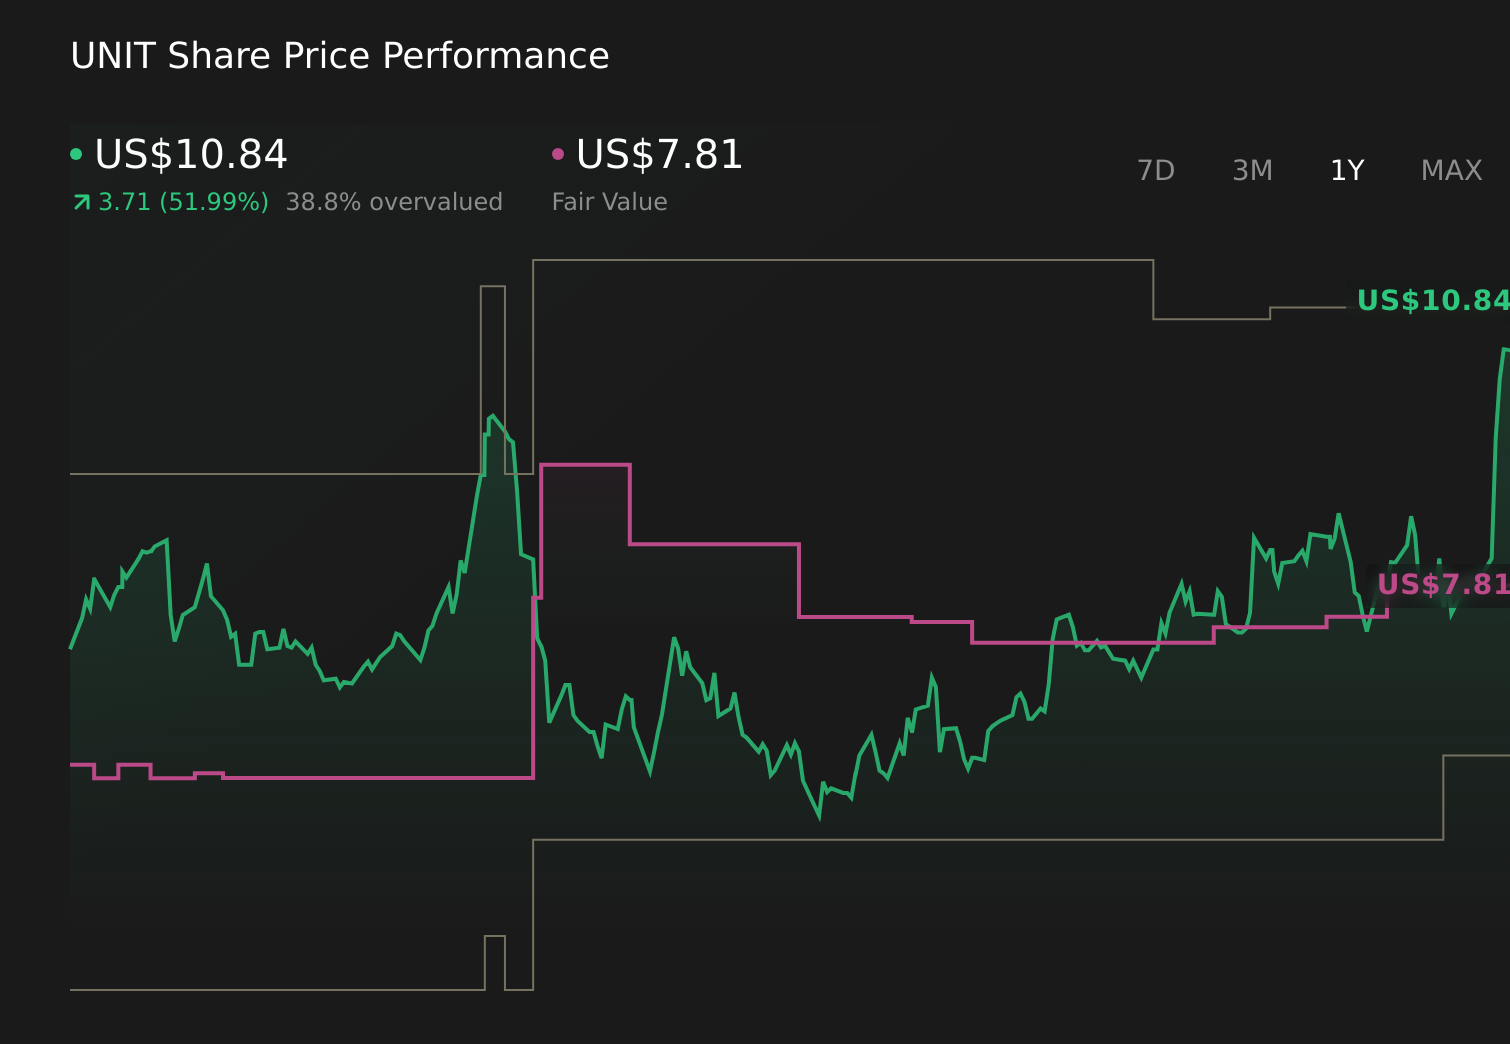
- If you are wondering whether Uniti Group's current share price reflects its underlying value, the recent performance gives you plenty to think about.
- The stock last closed at US$10.30, with returns of 27.2% over the past week, 28.0% over the past month, 50.8% year to date, 41.1% over one year, 132.0% over three years and a 19.9% decline over five years.
- Recent news coverage has focused on Uniti Group as investors reassess telecom infrastructure plays and their role in income and growth portfolios. This context helps frame whether recent price moves are being driven more by changing sentiment or by shifts in how the assets are being valued.
- On Simply Wall St's valuation checks, Uniti Group scores a 3 out of 6. The sections that follow will compare different valuation approaches, then conclude with a broader way to think about what this score really means for you.
Approach 1: Uniti Group Discounted Cash Flow (DCF) Analysis
A Discounted Cash Flow, or DCF, model estimates what a company could be worth today by projecting its future cash flows and then discounting those back to a present value.
For Uniti Group, the model used is a 2 Stage Free Cash Flow to Equity approach, based on cash flow projections in US$. The latest twelve month free cash flow is a loss of $415.5 million, and analyst based forecasts in the near term also point to negative free cash flow, such as a projected $474.2 million outflow in 2026 and $394.8 million in 2027. Further out, Simply Wall St extrapolates the forecasts, with free cash flow projected at $114.2 million in 2030 and continuing to rise in later years according to the model assumptions.
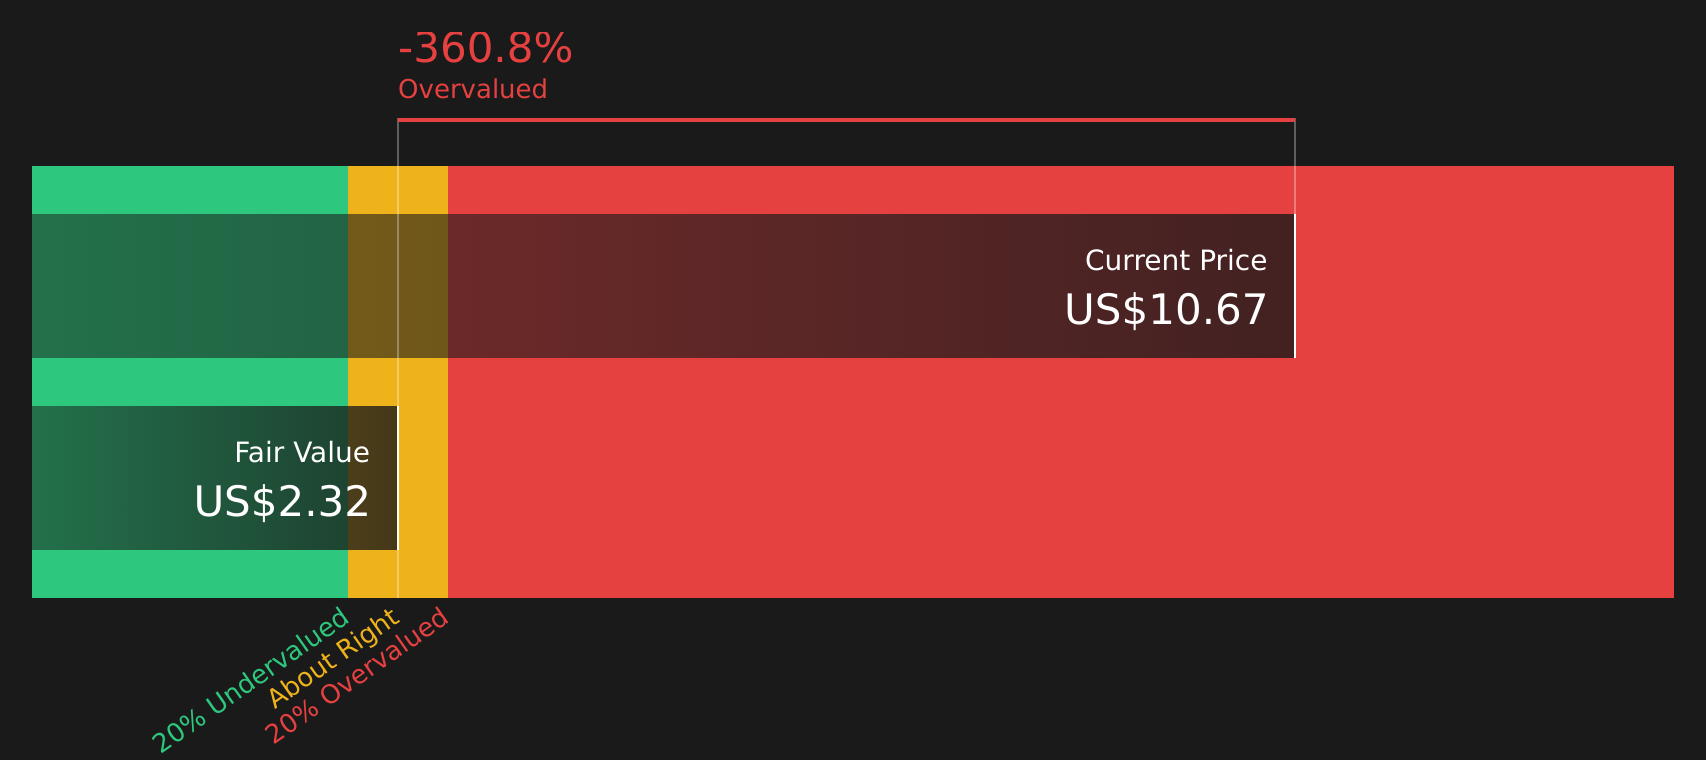
After discounting all these projected cash flows back to today, the model arrives at an estimated intrinsic value of about $2.32 per share. Against a recent share price of US$10.30, the DCF output implies the stock is very fully priced, with an indicated overvaluation of around 344.8%.
Result: OVERVALUED
Our Discounted Cash Flow (DCF) analysis suggests Uniti Group may be overvalued by 344.8%. Discover 62 high quality undervalued stocks or create your own screener to find better value opportunities.
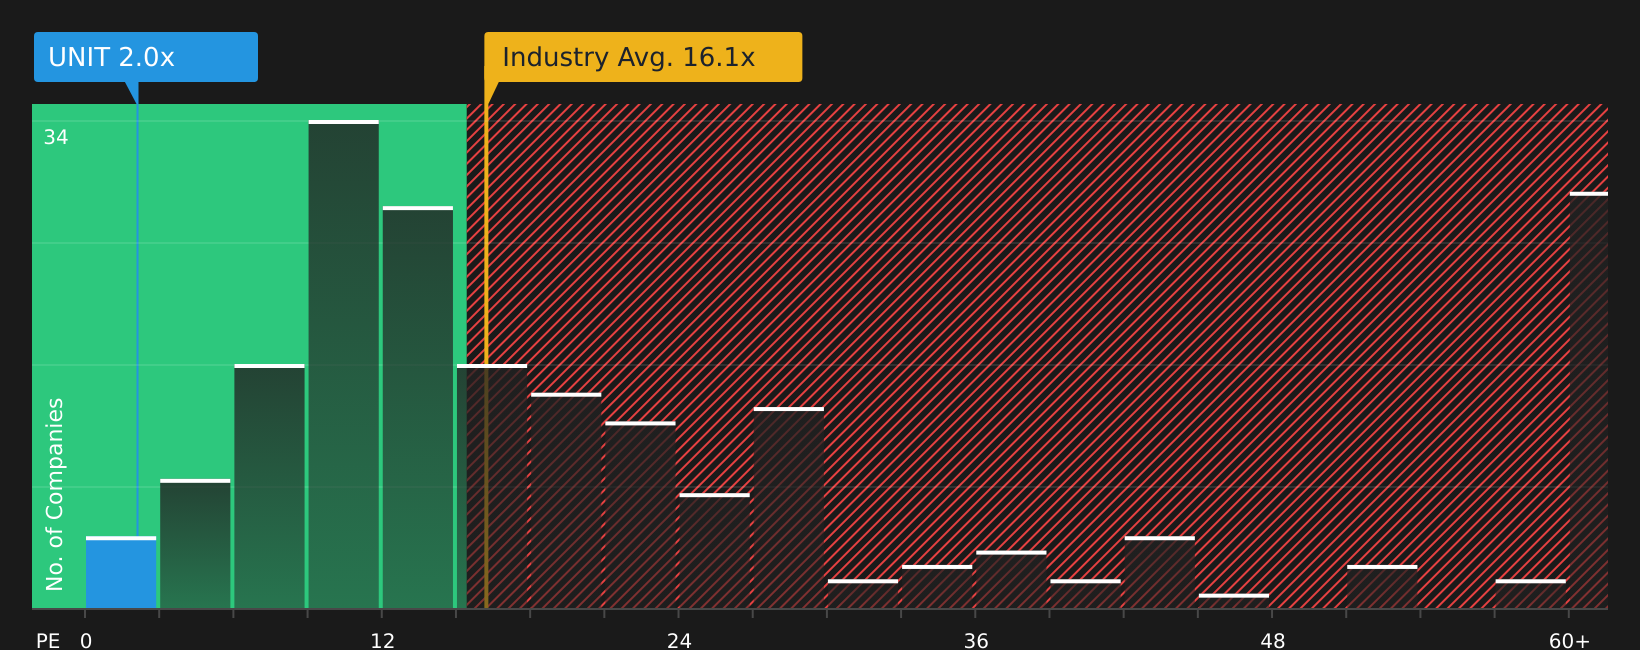
Approach 2: Uniti Group Price vs Earnings
For profitable companies, the P/E ratio is a useful way to relate what you pay per share to the earnings that support that price. A higher or lower P/E often reflects how the market weighs growth potential and risk, with faster growth or lower perceived risk usually linked to a higher "normal" P/E and slower growth or higher risk linked to a lower one.
Uniti Group currently trades on a P/E of 1.97x. This sits well below the Telecom industry average P/E of 15.95x and also below the peer group average of 8.80x. Simply Wall St also applies its proprietary "Fair Ratio" framework, which estimates what a reasonable P/E might be based on factors such as earnings growth, margins, industry, market cap and risk. For Uniti Group, this Fair Ratio is 7.82x.
Because the Fair Ratio adjusts for company specific drivers, it can be more informative than a simple comparison with peers or the broader industry. When the actual P/E of 1.97x is set against the Fair Ratio of 7.82x, Uniti Group screens as trading well below that modelled level.
Result: UNDERVALUED
P/E ratios tell one story, but what if the real opportunity lies elsewhere? Start investing in legacies, not executives. Discover our 20 top founder-led companies.
Upgrade Your Decision Making: Choose your Uniti Group Narrative
Earlier it was mentioned that there is an even better way to understand valuation. Narratives on Simply Wall St let you attach a clear story about Uniti Group to the numbers you care about, by linking your view of its revenue, earnings and margins to a financial forecast, a Fair Value, and then a simple comparison with the current price.
Each Narrative is created and updated on the Community page, so you can see how different investors frame Uniti Group. For example, one Narrative might anchor around a Fair Value close to US$6 based on concerns about leverage and funding risk. Another might use a Fair Value near US$11 that focuses on fiber expansion and AI related demand. Both Narratives will refresh as new news, guidance or earnings are added.
For Uniti Group however, we will make it really easy for you with previews of two leading Uniti Group Narratives:
Fair value in this bullish Narrative: US$10.77 per share
Current price vs this fair value: around 4.4% above the Narrative fair value
Revenue growth assumption in this Narrative: 32.44% a year
- Assumes fiber buildout, AI connectivity demand and rural exposure support higher long term earnings and cash flow than the current price implies.
- Leans on improving capital structure and financing terms to help reshape the balance sheet and support reinvestment.
- Requires confidence that Uniti can convert its fiber pipeline and hyperscaler interest into sustained revenue and margin expansion.
Fair value in this bearish Narrative: US$6.00 per share
Current price vs this fair value: about 71.7% above the Narrative fair value
Revenue growth assumption in this Narrative: 18.63% a year
- Highlights leverage, funding dependence and capital intensity as key pressure points for returns and financial flexibility.
- Flags competition from alternative broadband technologies and customer concentration as risks to revenue stability.
- Assumes the market may be paying too much today given execution risk on fiber buildouts and the path to more stable earnings.
Taken together, these Narratives frame the same company in very different ways. This is exactly the sort of tension you may want to see before making up your own mind about Uniti Group.
To see how these results tie into long-term growth, risks, and valuation, check out the full range of community narratives for Uniti Group on Simply Wall St. Add the company to your watchlist or portfolio so you'll be alerted when the story evolves.
Do you think there's more to the story for Uniti Group? Head over to our Community to see what others are saying!
This article by Simply Wall St is general in nature. We provide commentary based on historical data and analyst forecasts only using an unbiased methodology and our articles are not intended to be financial advice. It does not constitute a recommendation to buy or sell any stock, and does not take account of your objectives, or your financial situation. We aim to bring you long-term focused analysis driven by fundamental data. Note that our analysis may not factor in the latest price-sensitive company announcements or qualitative material. Simply Wall St has no position in any stocks mentioned.
Have feedback on this article? Concerned about the content? Get in touch with us directly. Alternatively, email editorial-team@simplywallst.com