
- LIVE QUOTES
- LEARN
- HELP


EN
Is It Time To Revisit Varonis Systems (VRNS) After Steep Share Price Declines?
- If you are wondering whether Varonis Systems at around US$21.74 is starting to look interesting on price, the key question is how that tag compares with what the business might reasonably be worth.
- The stock has seen mixed returns, with a 1.6% move over the last 7 days, a 5.8% decline over 30 days, and much steeper negative returns of 32.1% year to date and 47.7% over the past year.
- These moves have kept Varonis on many watchlists as investors reassess their appetite for higher risk software names and look more closely at the balance between growth expectations and current pricing. Even without headline grabbing announcements in the last few weeks, the stock's recent path suggests sentiment has been shifting.
- On Simply Wall St's valuation checks, Varonis currently scores 3 out of 6. This points to some areas where the shares may look cheaper and others where the market is less forgiving. The sections that follow will compare different valuation approaches before finishing with a broader way of thinking about what fair value really means for this stock.
Find out why Varonis Systems's -47.7% return over the last year is lagging behind its peers.
Approach 1: Varonis Systems Discounted Cash Flow (DCF) Analysis
A Discounted Cash Flow model estimates what a company could be worth by projecting its future cash flows and discounting them back to today using a required rate of return. It is essentially asking what those future dollars are worth in current terms.
For Varonis Systems, the model used is a 2 Stage Free Cash Flow to Equity approach based on cash flow projections in $. The latest twelve month free cash flow is about $138.3 million. Analysts provide specific forecasts for the next few years, and Simply Wall St then extrapolates further out. In this case, the ten year projections run from $103.4 million in 2026 to $471.9 million in 2035, with discounted values for each year included in the model. Within that, free cash flow for 2030 is projected at $304.4 million.
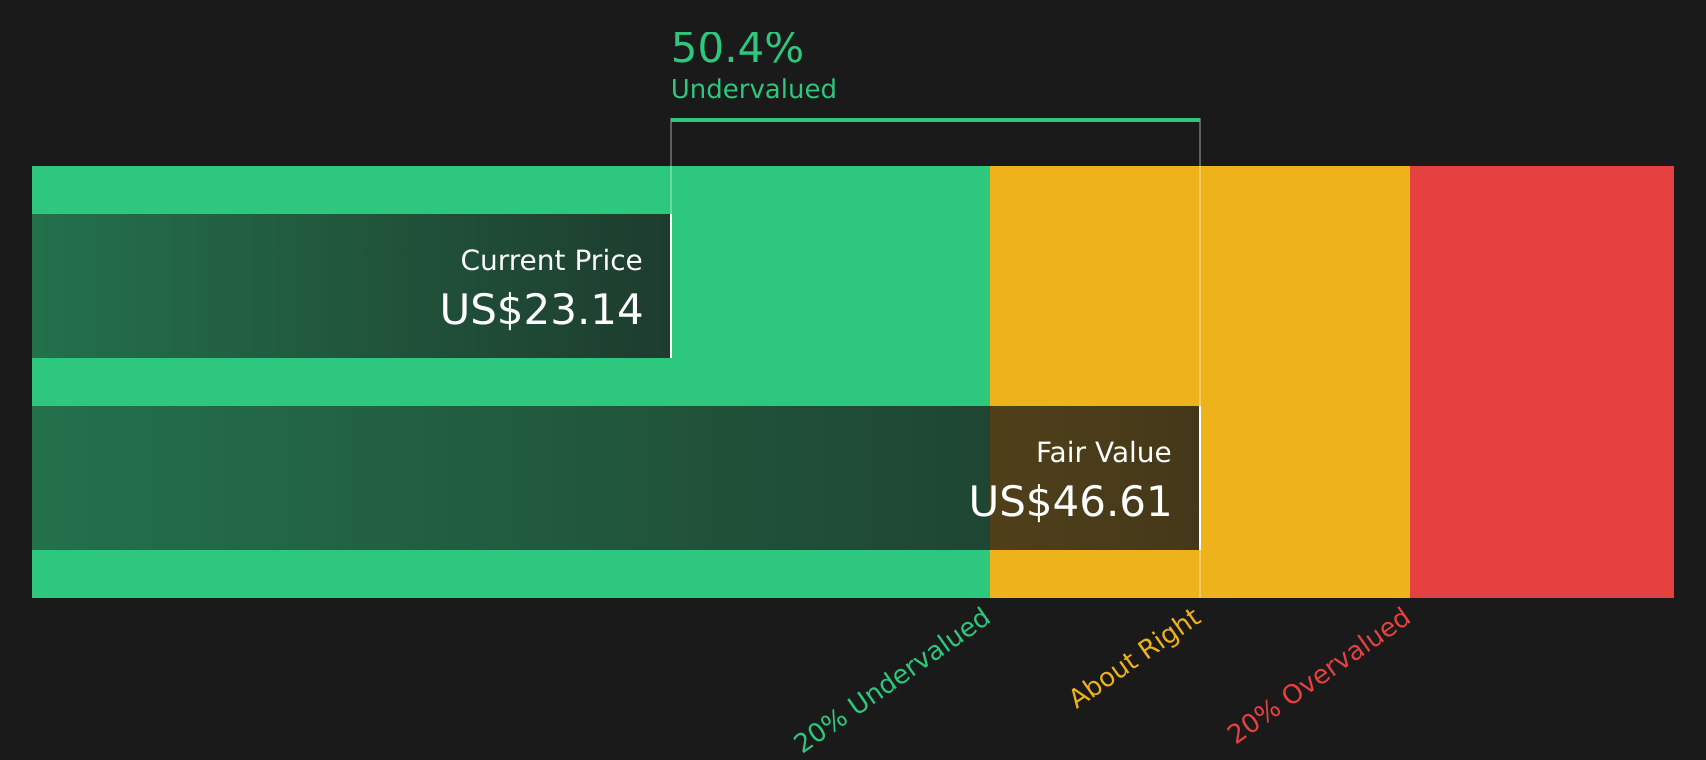
Bringing all those discounted cash flows together gives an estimated intrinsic value of about $46.26 per share. Compared with the recent share price of around $21.74, the model indicates that the shares are trading at about a 53.0% discount. On this approach, the shares screen as materially undervalued.
Result: UNDERVALUED
Our Discounted Cash Flow (DCF) analysis suggests Varonis Systems is undervalued by 53.0%. Track this in your watchlist or portfolio, or discover 63 more high quality undervalued stocks.
Approach 2: Varonis Systems Price vs Sales
For companies where profits are limited or still developing, the preferred multiple is often the price to sales ratio, because sales tend to be more stable and less affected by accounting adjustments than earnings. It gives you a cleaner sense of how much you are paying for each dollar of revenue.
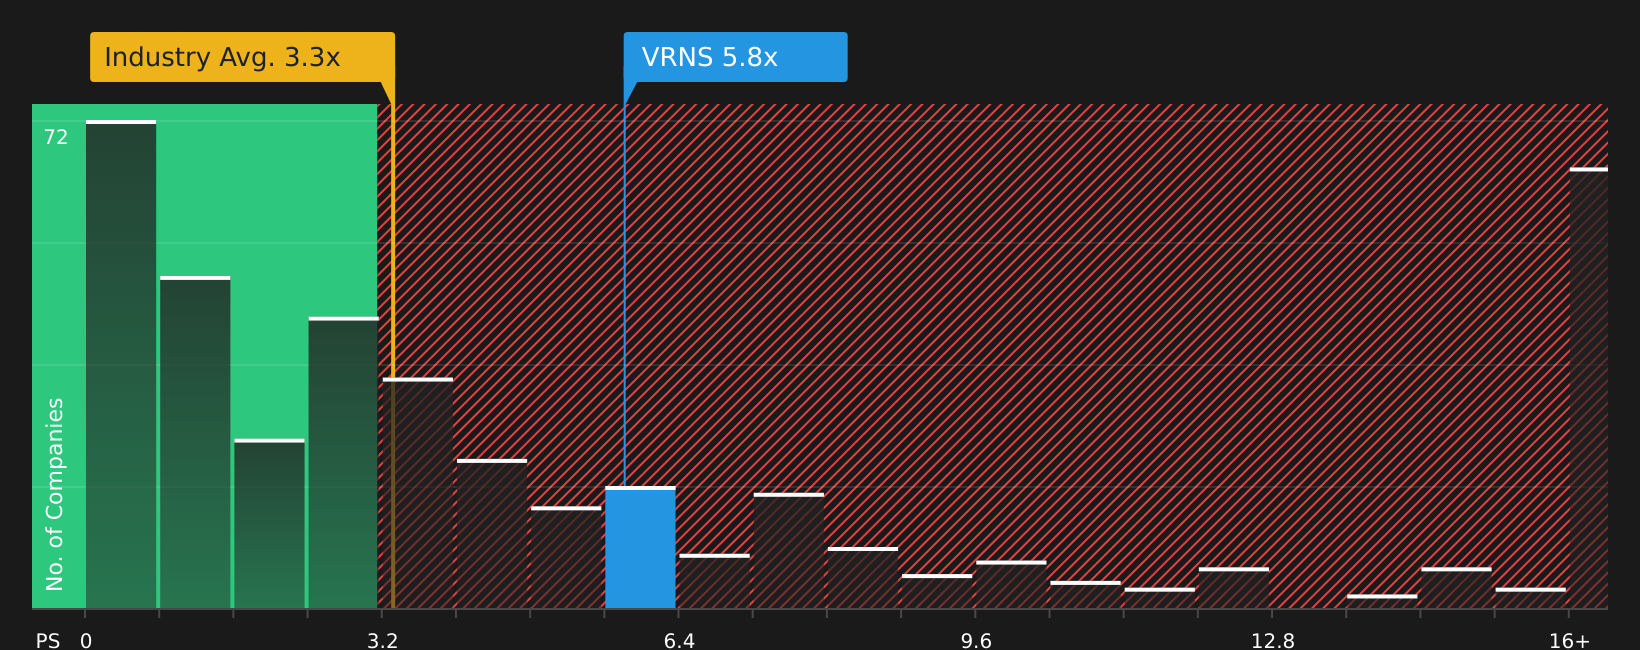
Growth expectations and risk still matter here, because faster, less risky growth usually justifies a higher “normal” or “fair” P/S multiple, while slower or more uncertain growth tends to support a lower one. Varonis Systems currently trades on a P/S of about 4.09x. That sits above the Software industry average of about 3.47x and the peer average of roughly 3.56x.
Simply Wall St’s proprietary Fair Ratio for Varonis, at about 4.39x, estimates what a reasonable P/S might be after factoring in elements such as earnings growth, profit margins, industry, market cap and company specific risks. This tailored yardstick can be more useful than a simple peer or industry comparison, because it adjusts for the company’s own characteristics rather than relying on broad group averages. On this measure, Varonis trades modestly below its Fair Ratio, which indicates that the shares screen as slightly undervalued using the P/S approach.
Result: UNDERVALUED
P/S ratios tell one story, but what if the real opportunity lies elsewhere? Start investing in legacies, not executives. Discover our 20 top founder-led companies.
Upgrade Your Decision Making: Choose your Varonis Systems Narrative
Earlier the article mentioned that there is an even better way to understand valuation, and that is where Narratives come in, letting you attach a clear story about Varonis Systems to the numbers you see, so your view on fair value, future revenue, earnings and margins all line up with a simple, written explanation you can revisit and refine.
A Narrative on Simply Wall St links three things in one place: your view of the company’s story, a forecast based on that view, and a resulting fair value that you can compare directly with the current share price to decide whether you see the stock as attractively priced or not.
On Simply Wall St’s Community page, these Narratives sit alongside each other and update as new information such as earnings, product launches or legal developments is added, so your fair value view is refreshed without you needing to rebuild a spreadsheet each time.
For Varonis Systems, one Narrative might lean closer to the higher US$62.00 fair value with a story that emphasizes AI security demand and a successful SaaS transition, while another might sit near US$27.00 and stress SaaS execution risks, competition and customer churn, and you can place your own view anywhere along that spectrum.
Do you think there's more to the story for Varonis Systems? Head over to our Community to see what others are saying!

This article by Simply Wall St is general in nature. We provide commentary based on historical data and analyst forecasts only using an unbiased methodology and our articles are not intended to be financial advice. It does not constitute a recommendation to buy or sell any stock, and does not take account of your objectives, or your financial situation. We aim to bring you long-term focused analysis driven by fundamental data. Note that our analysis may not factor in the latest price-sensitive company announcements or qualitative material. Simply Wall St has no position in any stocks mentioned.
Have feedback on this article? Concerned about the content? Get in touch with us directly. Alternatively, email editorial-team@simplywallst.com