
- LIVE QUOTES
- LEARN
- HELP


EN
Is DNOW (DNOW) Offering An Opportunity After A 29% One Year Share Price Slide
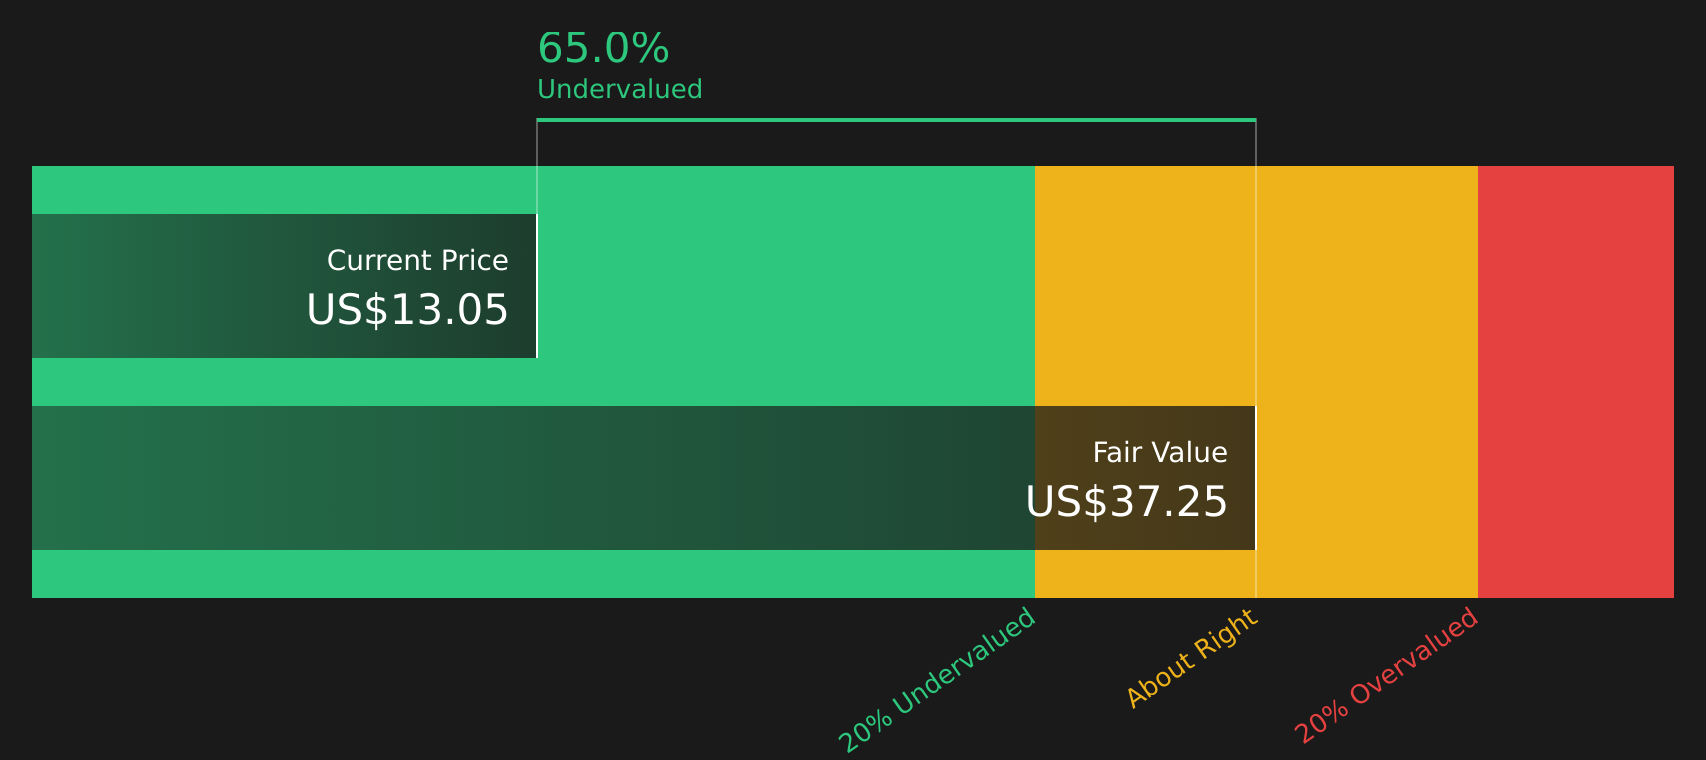
- If you are wondering whether DNOW at around US$11.99 is starting to look like value or is still pricing in too much optimism, this breakdown will help you frame the stock through a few clear valuation lenses.
- The share price has moved 7.8% over the past week but is still showing a 9.4% decline over 30 days, a 10.3% decline year to date and a 29.3% decline over the past year, which can change how the market is thinking about both risk and opportunity.
- Recent coverage has focused on DNOW’s place in the broader Trade Distributors space and how investors are weighing its positioning against industry peers. This context helps explain why a stock with a 3 year return of 8.7% and a 5 year return of 18.0% can still see pressure over shorter periods.
- On Simply Wall St’s 6 point valuation checklist, DNOW scores a 5 out of 6. The rest of this article will walk through the main valuation methods used to reach that result and will also flag an even more complete way to think about valuation at the end.
Find out why DNOW's -29.3% return over the last year is lagging behind its peers.
Approach 1: DNOW Discounted Cash Flow (DCF) Analysis
A Discounted Cash Flow, or DCF, model estimates what a business could be worth today by projecting its future cash flows and then discounting those back to a present value using a required rate of return.
For DNOW, the model used is a 2 Stage Free Cash Flow to Equity approach, working off last twelve month free cash flow of about $137.4 million. Analysts provide explicit forecasts for several years, and Simply Wall St then extends those estimates further using its own assumptions to build a ten year path.
Within those projections, forecast free cash flow reaches $317.8 million in 2035, with each year’s figure discounted back to today in dollars. Adding these discounted values together, along with a terminal value, produces an estimated intrinsic value of $24.05 per share.
Compared with a current share price of about $11.99, the DCF output suggests DNOW is trading at a 50.1% discount to that estimate, which indicates the stock may be materially undervalued on this cash flow outlook based on the model’s inputs and assumptions.
Result: UNDERVALUED
Our Discounted Cash Flow (DCF) analysis suggests DNOW is undervalued by 50.1%. Track this in your watchlist or portfolio, or discover 58 more high quality undervalued stocks.
Approach 2: DNOW Price vs Sales
For companies where revenue is a key anchor and profits can move around, the P/S ratio is often a practical way to compare what you are paying for each dollar of sales. It gives you a cleaner read when earnings are less consistent or when reported earnings do not fully reflect underlying activity.
What counts as a “normal” P/S depends on what the market expects for growth and how it views risk. Higher expected growth and lower perceived risk usually support a higher multiple, while slower growth or higher uncertainty tend to pull that multiple down.
DNOW is trading on a P/S of 0.79x. That sits below the Trade Distributors industry average P/S of 1.22x and below the broader peer group average of 1.87x. Simply Wall St’s Fair Ratio for DNOW is 1.51x, which is its proprietary estimate of a suitable P/S once factors like earnings growth, industry, profit margins, market cap and key risks are brought together into one number.
This Fair Ratio helps more than a straight peer or industry comparison because it adjusts for DNOW’s specific profile rather than assuming all companies deserve the same multiple. With the current 0.79x P/S sitting below the 1.51x Fair Ratio, the stock appears undervalued on this measure.
Result: UNDERVALUED

P/S ratios tell one story, but what if the real opportunity lies elsewhere? Start investing in legacies, not executives. Discover our 20 top founder-led companies.
Upgrade Your Decision Making: Choose your DNOW Narrative
Earlier it was mentioned that there is an even better way to understand valuation. Narratives on Simply Wall St’s Community page let you attach a clear story about DNOW, including your assumptions for future revenue, earnings, margins and fair value. You can then compare that fair value with today’s price to decide whether the stock looks cheap or expensive. Each Narrative automatically updates when new information such as news, earnings or the latest analyst view comes in. Some investors currently build a case around a fair value of US$16.00 per share, while others take a more cautious stance. You can see both ends of that spectrum side by side and decide which version of DNOW’s story fits your own view.
Do you think there's more to the story for DNOW? Head over to our Community to see what others are saying!

This article by Simply Wall St is general in nature. We provide commentary based on historical data and analyst forecasts only using an unbiased methodology and our articles are not intended to be financial advice. It does not constitute a recommendation to buy or sell any stock, and does not take account of your objectives, or your financial situation. We aim to bring you long-term focused analysis driven by fundamental data. Note that our analysis may not factor in the latest price-sensitive company announcements or qualitative material. Simply Wall St has no position in any stocks mentioned.
Have feedback on this article? Concerned about the content? Get in touch with us directly. Alternatively, email editorial-team@simplywallst.com