
- LIVE QUOTES
- LEARN
- HELP


EN
Has Emerson Electric (EMR) Run Too Far After Its Strong Multi‑Year Share Price Rally?
- If you are wondering whether Emerson Electric is still reasonably priced after a long run in the market, this article walks through what the current share price might be implying about value.
- The stock recently closed at US$129.83, with returns of 14.4% over 1 year and 66.1% over 3 years. This is despite a 12.6% decline over the last 30 days and a year-to-date return that currently reflects a 4.4% decline.
- Recent market attention has focused on Emerson Electric as a large industrial name that has already delivered 57.6% over 5 years. Some investors are now reassessing whether the current level still makes sense. That reassessment often shows up in short-term moves, such as the 2.4% decline over the last week, as sentiment shifts between enthusiasm and caution.
- Emerson Electric currently has a valuation score of 3/6. This sets up a closer look at how different models, including P/E style checks and discounted cash flow, compare with one another and how a broader framework later in the article might provide an even clearer view of value.
Find out why Emerson Electric's 14.4% return over the last year is lagging behind its peers.
Approach 1: Emerson Electric Discounted Cash Flow (DCF) Analysis
A Discounted Cash Flow, or DCF, model takes projected future cash flows and then discounts them back to today to estimate what the business might be worth right now. It is essentially asking what a stream of future cash in your pocket could be worth in present terms.
For Emerson Electric, the model used is a 2 Stage Free Cash Flow to Equity approach that starts from last twelve months free cash flow of about $2.6b. Analysts provide cash flow estimates for several years, and Simply Wall St then extends those out to a 10 year view, with projected free cash flow in 2030 of $4.9b. The ten year pathway combines analyst inputs for the nearer years with extrapolated estimates for the later ones, all expressed in dollars and then discounted back to today.
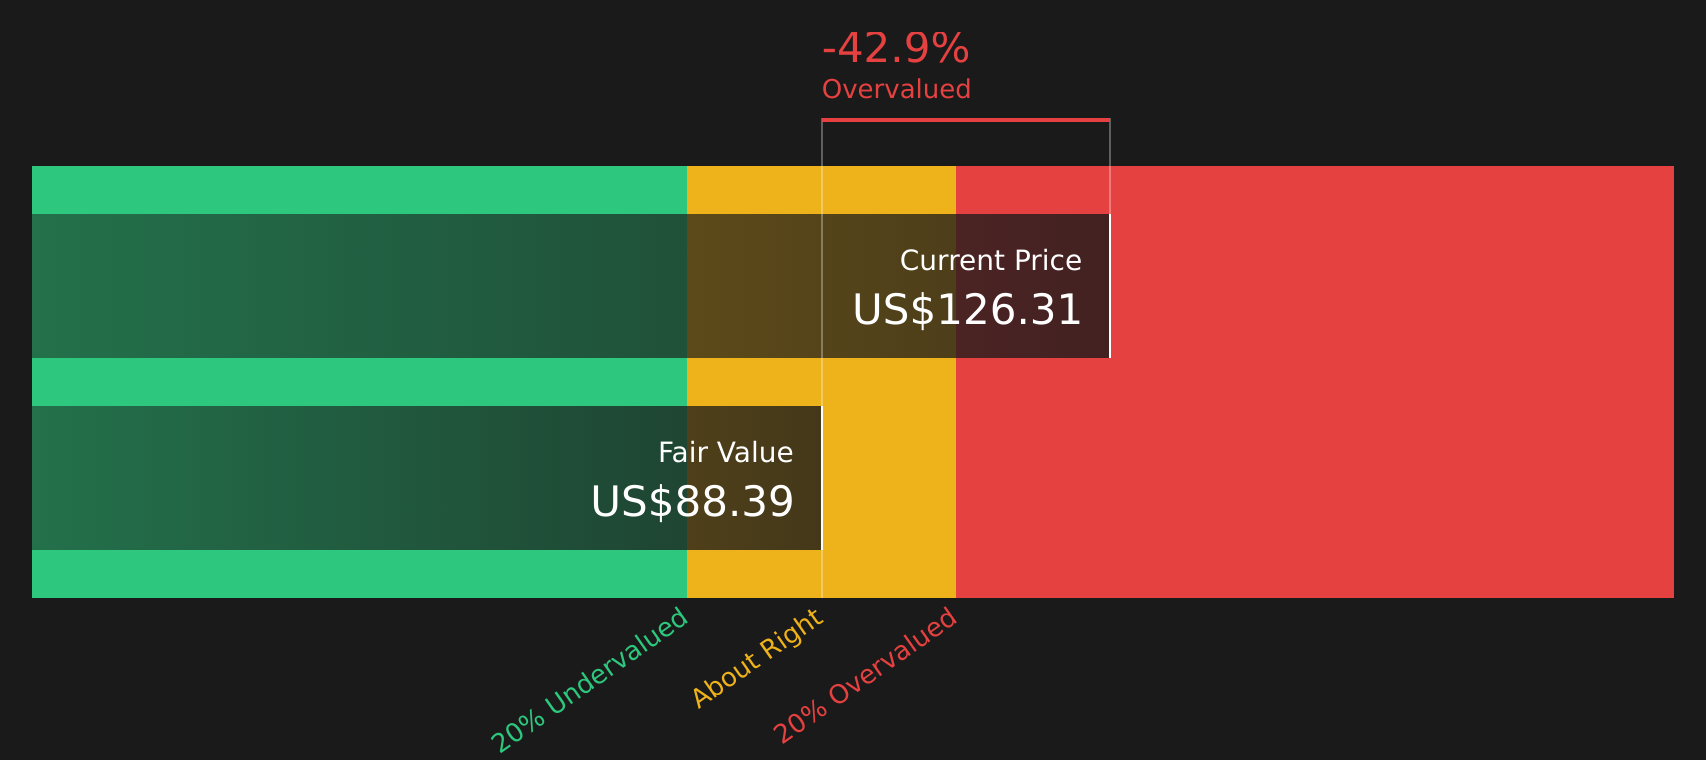
On this basis, the DCF model arrives at an estimated intrinsic value of about $88.39 per share. Compared with the recent share price of $129.83, the output indicates the stock is about 46.9% above this intrinsic value, which points to it being overvalued on this specific cash flow model.
Result: OVERVALUED
Our Discounted Cash Flow (DCF) analysis suggests Emerson Electric may be overvalued by 46.9%. Discover 55 high quality undervalued stocks or create your own screener to find better value opportunities.
Approach 2: Emerson Electric Price vs Earnings
For a profitable company, the P/E ratio is a common way to think about what you are paying for each dollar of earnings. Investors usually accept a higher P/E when they expect stronger growth or see lower risk, and look for a lower P/E when growth expectations are more modest or risks are higher.
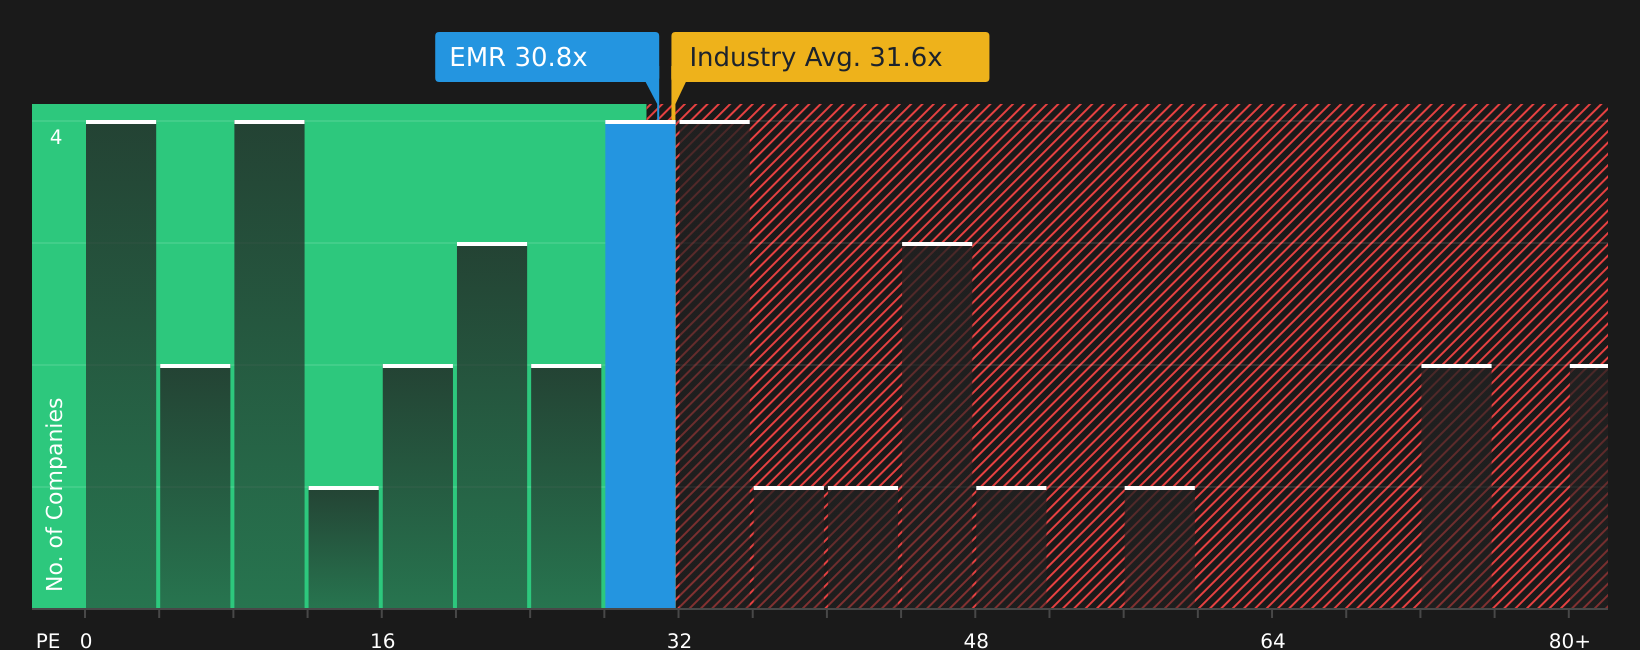
Emerson Electric currently trades on a P/E of 31.65x. That sits close to the Electrical industry average P/E of 31.42x and below the peer group average of 45.32x. Simply Wall St also calculates a Fair Ratio for Emerson Electric of 40.18x, which reflects factors such as its earnings growth profile, industry, profit margins, market value and company specific risks.
This Fair Ratio is designed to be more tailored than a straight comparison with peers or the industry. It adjusts for differences in growth, risk and profitability rather than assuming all companies deserve the same multiple. Comparing Emerson Electric’s current P/E of 31.65x with the Fair Ratio of 40.18x suggests the shares are trading below the level implied by this framework.
Result: UNDERVALUED
P/E ratios tell one story, but what if the real opportunity lies elsewhere? Start investing in legacies, not executives. Discover our 20 top founder-led companies.
Upgrade Your Decision Making: Choose your Emerson Electric Narrative
Earlier it was mentioned that there is an even better way to understand valuation. Narratives are introduced as a simple way for you to connect your view of Emerson Electric’s story to a financial forecast and a fair value. By setting assumptions for future revenue, earnings and margins, you can compare the resulting Fair Value to the current price on Simply Wall St’s Community page. Narratives used by millions of investors update automatically when fresh news or earnings arrive and can span a wide range of opinions, from a more optimistic view that sees a Fair Value around US$204 per share to a more cautious view closer to US$120.65 per share, reflecting different beliefs about AI exposure, margins, growth and risk.
For Emerson Electric however, here are previews of two leading Emerson Electric Narratives to make comparison easier:
Fair value in this bullish narrative: US$204.00 per share.
Implied price gap versus the last close of US$129.83: about 36.4% below this fair value level.
Revenue growth assumption in this bullish view: around 7.14% a year.
- Analysts in this camp lean on AI enabled automation, AspenTech synergies and grid or electrification demand as key supports for higher long term revenue and margins.
- This view assumes Emerson steadily shifts toward higher growth verticals and a larger software or SaaS mix, which they see as improving earnings visibility and recurring revenue.
- To reach the higher fair value, this narrative pairs stronger earnings in 2028 with a P/E of 36.89x and assumes investors remain comfortable with that multiple.
Fair value in this cautious narrative: about US$120.65 per share.
Implied price gap versus the last close of US$129.83: roughly 7.6% above this fair value level.
Revenue growth assumption in this cautious view: around 5.52% a year.
- Analysts behind this narrative focus on protectionism, softer industrial demand in some regions and integration risks as potential pressures on margins and earnings momentum.
- They see growing competition from low cost and open source style automation as a headwind for pricing power and long term growth in some of Emerson's legacy hardware lines.
- Even with earnings growth expected, this view assumes a future P/E of 27.26x and argues that the current share price already reflects much of the anticipated improvement.
If you want to go beyond the previews and see how your own expectations line up with these scenarios, you can compare the full set of community narratives, adjust the assumptions that matter most to you and see how that changes the implied fair value for Emerson Electric over time.
Do you think there's more to the story for Emerson Electric? Head over to our Community to see what others are saying!

This article by Simply Wall St is general in nature. We provide commentary based on historical data and analyst forecasts only using an unbiased methodology and our articles are not intended to be financial advice. It does not constitute a recommendation to buy or sell any stock, and does not take account of your objectives, or your financial situation. We aim to bring you long-term focused analysis driven by fundamental data. Note that our analysis may not factor in the latest price-sensitive company announcements or qualitative material. Simply Wall St has no position in any stocks mentioned.
Have feedback on this article? Concerned about the content? Get in touch with us directly. Alternatively, email editorial-team@simplywallst.com