
- LIVE QUOTES
- LEARN
- HELP


EN
Is Liberty Latin America (LILA) Offering Value After Recent Share Price Gains?
- Wondering whether Liberty Latin America at around US$7.96 is priced for opportunity or already reflects the key information you care about?
- The stock has returned 5.3% over the last week, 1.5% over the past month, 9.6% year to date and 17.2% over the last year. The 3 year return is 2.4% and the 5 year return is a 41.4% decline.
- Recent coverage of Liberty Latin America has focused on its position within the broader telecom sector and how investors are reacting to its capital allocation and regional exposure. This context helps explain why the share price has moved in short bursts rather than in a straight line.
- On Simply Wall St's value checks, Liberty Latin America scores 5 out of 6. The rest of this article breaks down how different valuation approaches arrive at that result and saves the most practical way to interpret those numbers for the end.
Approach 1: Liberty Latin America Discounted Cash Flow (DCF) Analysis
A Discounted Cash Flow, or DCF, model takes estimates of future cash flows that a company may generate and discounts them back to a single value in today’s dollars. It is a way of asking what those future cash flows are worth right now.
For Liberty Latin America, Simply Wall St uses a 2 Stage Free Cash Flow to Equity model based on cash flow projections. The latest twelve month free cash flow is about $267.1 million. Analyst inputs and extrapolations from Simply Wall St project free cash flow reaching $617.5 million in 2030, with a series of annual figures between 2026 and 2035 that are discounted back to today.
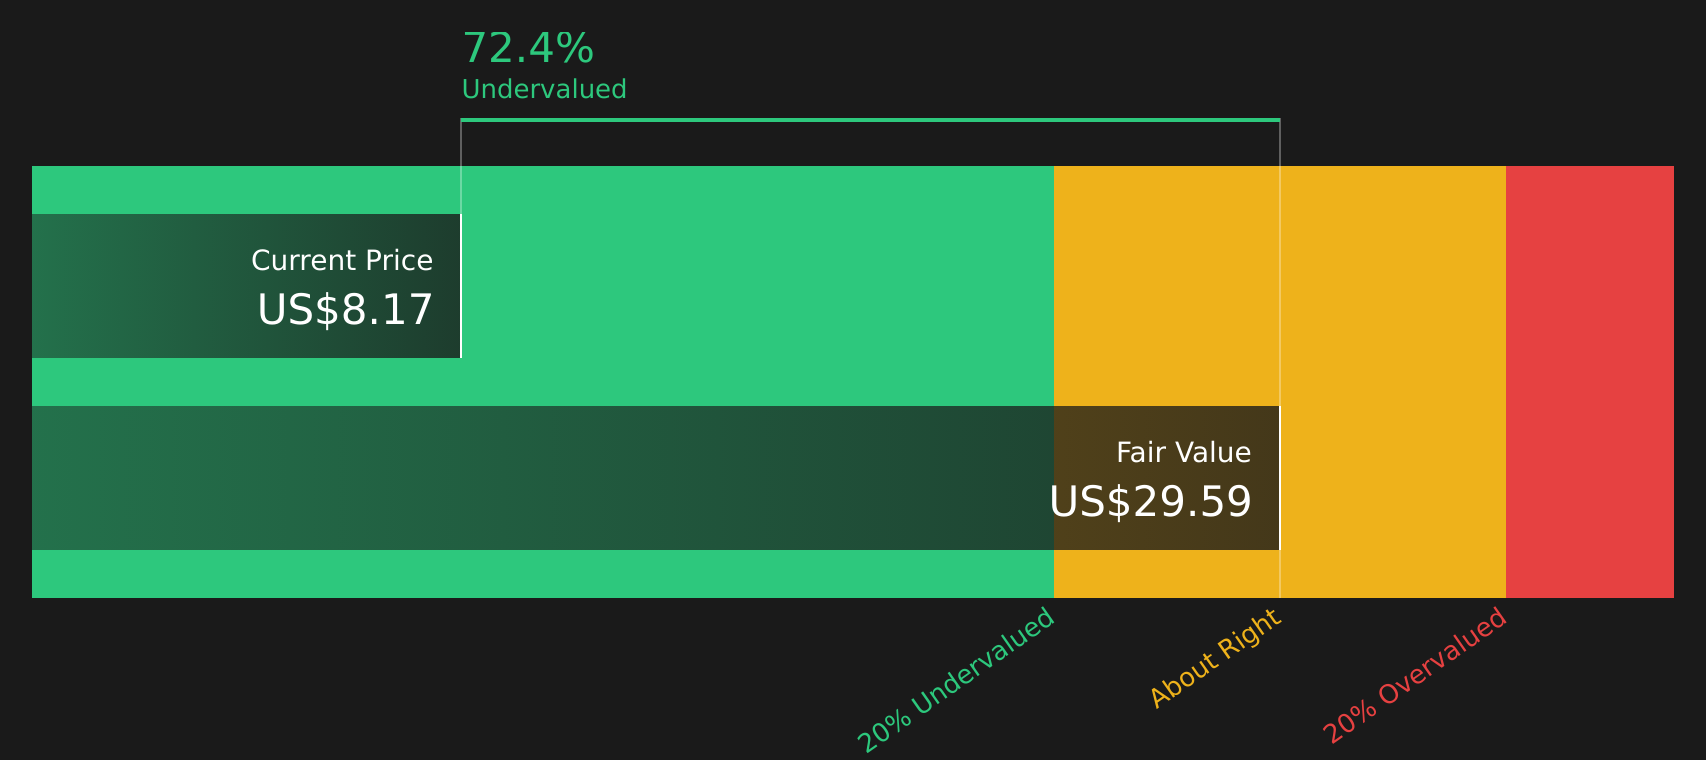
Combining these discounted cash flows produces an estimated intrinsic value of about $30.14 per share. Compared with a recent share price around $7.96, the model implies the stock trades at a 73.6% discount to this DCF estimate. This indicates a material potential valuation gap if the projections and assumptions hold.
Result: UNDERVALUED
Our Discounted Cash Flow (DCF) analysis suggests Liberty Latin America is undervalued by 73.6%. Track this in your watchlist or portfolio, or discover 49 more high quality undervalued stocks.
Approach 2: Liberty Latin America Price vs Sales
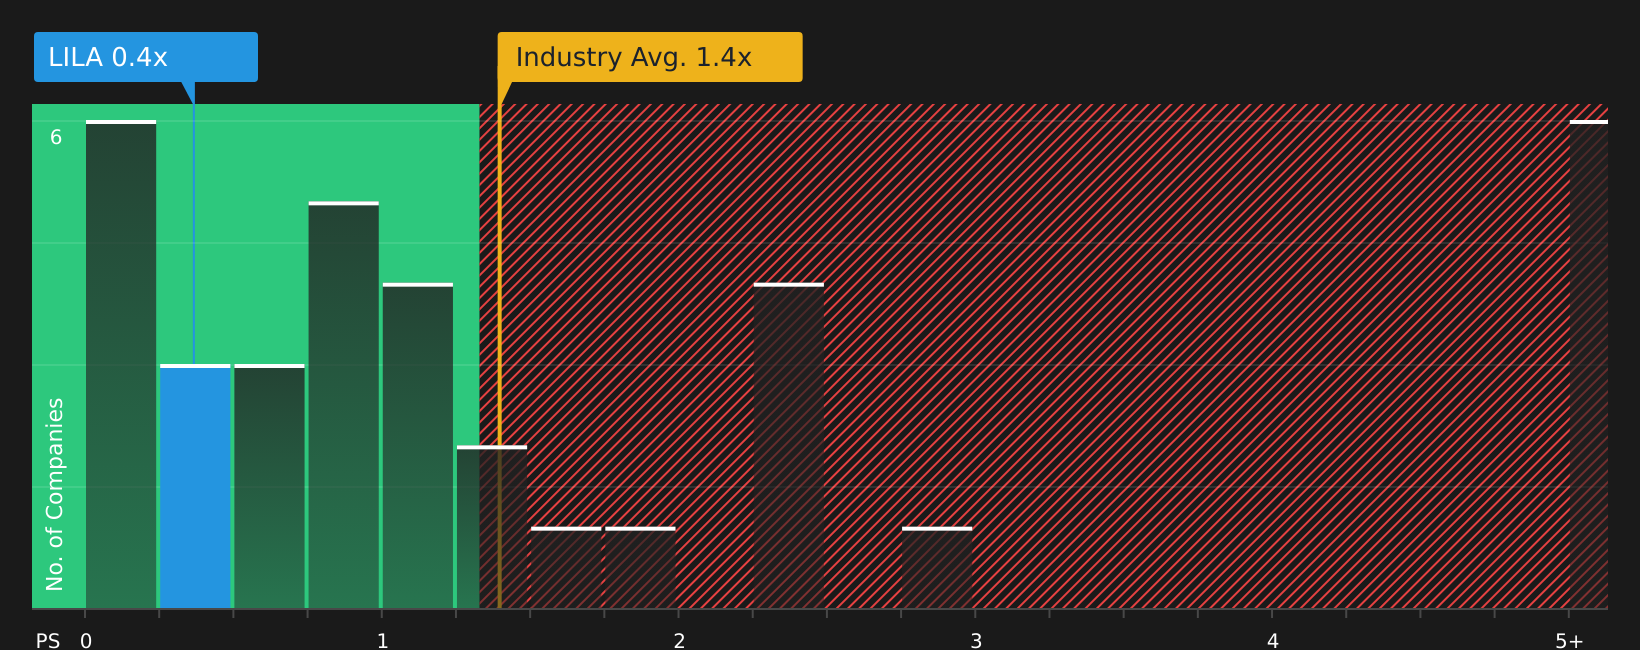
For companies where earnings are not the cleanest guide, price based on revenue can be useful, so the P/S ratio is the preferred multiple here. Investors usually accept a higher or lower P/S depending on expectations for future growth and how risky the business is, so there is no single “right” level that fits every stock.
Liberty Latin America currently trades on a P/S of 0.36x. This sits well below the Telecom industry average P/S of 1.34x and also below the peer group average of 2.10x. On the surface, this points to the market assigning a lower value to each dollar of revenue compared with many telecom peers.
Simply Wall St’s Fair Ratio for Liberty Latin America is 1.61x. This is a proprietary estimate of what the P/S might be given factors such as growth profile, profit margins, industry, market cap and key risks. Because it blends these company specific drivers, it can be more informative than a simple comparison with broad industry or peer averages.
With the current 0.36x P/S sitting below the 1.61x Fair Ratio, the shares screen as undervalued on this metric.
Result: UNDERVALUED
P/S ratios tell one story, but what if the real opportunity lies elsewhere? Start investing in legacies, not executives. Discover our 20 top founder-led companies.
Upgrade Your Decision Making: Choose your Liberty Latin America Narrative
Earlier it was mentioned that there is an even better way to understand valuation. This is where Narratives come in, a simple way for you to attach a clear story about Liberty Latin America to the numbers you see, linking your view of its revenue, earnings and margins to a forecast and then to a Fair Value that can be compared with the current share price to help you judge whether it looks attractive or expensive.
On Simply Wall St's Community page, Narratives are an accessible tool used by millions of investors that update automatically when fresh information such as earnings or news is added. This means your Fair Value view does not stay static while the world moves.
For Liberty Latin America, one investor might build a cautious Narrative around a Fair Value near US$6.00, focused on modest 1.9% revenue growth, profit margins near 5.3% and a P/E of 6.9x by 2028. Another might choose a more optimistic Narrative closer to US$14.90, using 4.0% revenue growth, margins near 6.5% and a 13.3x P/E. Your own view can sit anywhere between those anchors depending on which story you find more reasonable.
Do you think there's more to the story for Liberty Latin America? Head over to our Community to see what others are saying!

This article by Simply Wall St is general in nature. We provide commentary based on historical data and analyst forecasts only using an unbiased methodology and our articles are not intended to be financial advice. It does not constitute a recommendation to buy or sell any stock, and does not take account of your objectives, or your financial situation. We aim to bring you long-term focused analysis driven by fundamental data. Note that our analysis may not factor in the latest price-sensitive company announcements or qualitative material. Simply Wall St has no position in any stocks mentioned.
Have feedback on this article? Concerned about the content? Get in touch with us directly. Alternatively, email editorial-team@simplywallst.com