
- LIVE QUOTES
- LEARN
- HELP


EN
Is It Too Late To Consider Oceaneering International (OII) After Strong 1-Year Share Gains?
- If you are wondering whether Oceaneering International is still reasonably priced after recent gains, this article walks through what the current share price might be implying about the company.
- The stock trades at US$33.28, with returns of 33.9% year to date and 65.2% over the last year, even after 7 day and 30 day declines of 2.7% and 2.9%.
- Recent coverage has focused on Oceaneering International as an energy services name tied to subsea and offshore activity. This helps frame how investors are thinking about future project demand and contract visibility, and these headlines give useful context when weighing whether the current share price still lines up with the underlying business profile.
- On Simply Wall St's 6 point valuation checklist, Oceaneering International scores a 4 out of 6. Next, we will look at what different valuation approaches say about that score, as well as a broader way to think about the company's value by the end of the article.
Approach 1: Oceaneering International Discounted Cash Flow (DCF) Analysis
A Discounted Cash Flow, or DCF, model estimates what a business might be worth today by projecting its future cash flows and then discounting those cash flows back to a present value.
For Oceaneering International, the model used is a 2 Stage Free Cash Flow to Equity approach. The company’s last twelve months Free Cash Flow is $206.1 million, and Simply Wall St’s model uses analyst inputs for the earlier years, then extends those projections further out. On this basis, projected Free Cash Flow for 2030 is $221 million, with each forecast expressed in US dollars and discounted back to reflect today’s value of that cash.
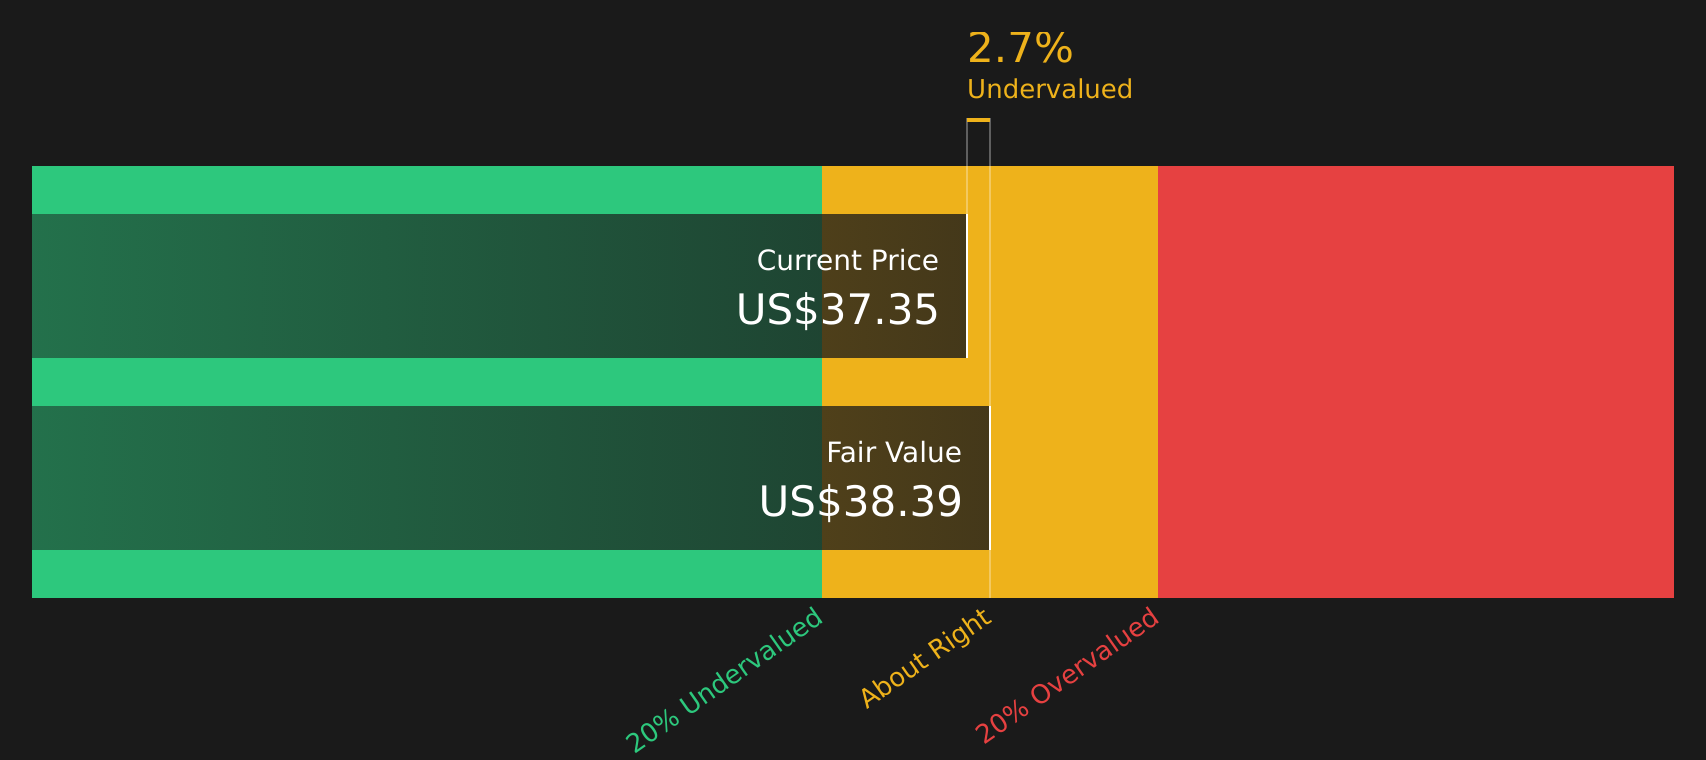
When all projected and discounted cash flows are added up, the DCF model points to an estimated intrinsic value of about $37.35 per share, compared with the current share price of $33.28. That implies the shares trade at roughly a 10.9% discount to this DCF estimate. In this model, the stock appears modestly undervalued on this measure.
Result: UNDERVALUED
Our Discounted Cash Flow (DCF) analysis suggests Oceaneering International is undervalued by 10.9%. Track this in your watchlist or portfolio, or discover 48 more high quality undervalued stocks.
Approach 2: Oceaneering International Price vs Earnings
For a profitable company, the P/E ratio is a straightforward way to think about what you are paying for each dollar of current earnings. It is therefore a useful cross check alongside a DCF model. Higher growth expectations and lower perceived risk usually support a higher P/E, while slower growth or higher risk tend to justify a lower multiple.
Oceaneering International currently trades on a P/E of 9.35x. That sits below the Energy Services industry average P/E of 26.16x and the peer group average of 47.85x, so the market is assigning it a lower multiple than many comparable names. Simply Wall St’s “Fair Ratio” for Oceaneering International is 10.76x, which is the P/E level its model suggests based on factors such as the company’s earnings growth profile, industry, profit margins, market cap and risk characteristics.
This Fair Ratio is more tailored than a simple comparison with peers or the industry average, because it adjusts for company specific features rather than assuming all Energy Services firms deserve the same multiple. Comparing the Fair Ratio of 10.76x with the current P/E of 9.35x points to the shares trading below this modelled level. On this metric, the stock appears to be undervalued relative to the model output.
Result: UNDERVALUED

P/E ratios tell one story, but what if the real opportunity lies elsewhere? Start investing in legacies, not executives. Discover our 18 top founder-led companies.
Upgrade Your Decision Making: Choose your Oceaneering International Narrative
Earlier we mentioned that there is an even better way to understand valuation, so let us introduce you to Narratives, a simple tool on Simply Wall St’s Community page where you connect your story about Oceaneering International with explicit assumptions for future revenue, earnings, margins and a Fair Value, then compare that Fair Value with the current share price to decide whether the stock looks attractive to you. The platform updates your view automatically when new information like earnings or news arrives. You can see, for example, one investor mapping out a higher Fair Value of about US$35.00 based on stronger confidence in FY26 guidance and segment resilience, while another anchors closer to US$17.50 on concerns about the energy transition and long term offshore demand. You can then use those different Narratives as clear, side by side scenarios to test and refine your own outlook.
For Oceaneering International, here are previews of two leading Oceaneering International Narratives:
🐂 Oceaneering International Bull Case
Fair value in this bullish narrative: US$35.00 per share
Implied discount to this fair value: about 4.9% using the narrative fair value
Revenue growth used in this view: 6.58% a year
- Assumes the company continues to benefit from offshore energy and infrastructure work, with steady FY26 EBITDA guidance and segment resilience in areas like ADTech and subsea robotics.
- Builds in higher modeled revenue growth but with a lower net profit margin, and uses a higher future P/E multiple to reflect what bullish analysts see as a stronger earnings profile.
- Factors in updated analyst work that raised the narrative fair value from US$25.00 to US$35.00, alongside a slightly lower discount rate and revised expectations for revenue mix and earnings quality.
🐻 Oceaneering International Bear Case
Fair value in this cautious narrative: US$27.50 per share
Implied premium to this fair value: about 21.5% using the narrative fair value
Revenue growth used in this view: 6.44% a year
- Emphasizes the risk that enthusiasm around themes like Venezuela related offshore work could outrun how quickly projects actually convert into revenue and earnings.
- Frames the business as exposed to energy transition trends, competition and offshore spending cycles, with a lower profit margin assumption and a future P/E multiple that still steps up from today but remains below very bullish cases.
- Reflects updated analyst models that lifted fair value from US$22.38 to US$27.50, while also cutting assumed margins and using a richer earnings multiple, leaving only a modest gap between current price levels and the consensus view.
If you want to see how the rest of the community is thinking through these scenarios and others, Curious how numbers become stories that shape markets? Explore Community Narratives and compare your own view on Oceaneering International with theirs.
Do you think there's more to the story for Oceaneering International? Head over to our Community to see what others are saying!

This article by Simply Wall St is general in nature. We provide commentary based on historical data and analyst forecasts only using an unbiased methodology and our articles are not intended to be financial advice. It does not constitute a recommendation to buy or sell any stock, and does not take account of your objectives, or your financial situation. We aim to bring you long-term focused analysis driven by fundamental data. Note that our analysis may not factor in the latest price-sensitive company announcements or qualitative material. Simply Wall St has no position in any stocks mentioned.
Have feedback on this article? Concerned about the content? Get in touch with us directly. Alternatively, email editorial-team@simplywallst.com