
- LIVE QUOTES
- LEARN
- HELP


EN
Is Liberty Latin America (LILA) Attractive After Years Of Share Price Weakness
- If you are wondering whether Liberty Latin America is priced attractively right now, this article will walk through how its current share price stacks up against different ways of thinking about value.
- The stock closed at US$7.79 most recently, with returns of 0.8% over the last 7 days, 2.2% over 30 days, 7.3% year to date, 12.2% over 1 year, and longer term returns of an 11.0% decline over 3 years and a 40.1% decline over 5 years that many investors will want to put into context.
- Recent coverage of Liberty Latin America has focused on its position as a telecom operator across multiple Latin American markets and ongoing interest in how its regional footprint fits into broader sector trends. This backdrop helps frame why the market may be reassessing the company and why the recent share price path stands out.
- On our checks, Liberty Latin America scores a 5 out of 6 valuation score, which suggests the stock screens as undervalued on most of the measures we track. Next, we will walk through those methods in detail before finishing with a broader way to think about valuation that goes beyond the numbers alone.
Approach 1: Liberty Latin America Discounted Cash Flow (DCF) Analysis
A Discounted Cash Flow, or DCF, model takes the cash Liberty Latin America is expected to generate in the future and discounts those projections back into today’s dollars to estimate what the business might be worth right now.
For Liberty Latin America, the model here is a 2 Stage Free Cash Flow to Equity approach. The company’s last twelve months Free Cash Flow is about US$267.1 million. Analysts have provided Free Cash Flow estimates out to 2030, with Simply Wall St extrapolating beyond the usual 5 year window. By 2035, the projections used in the model reach the equivalent of just under US$1.0 billion in annual Free Cash Flow.
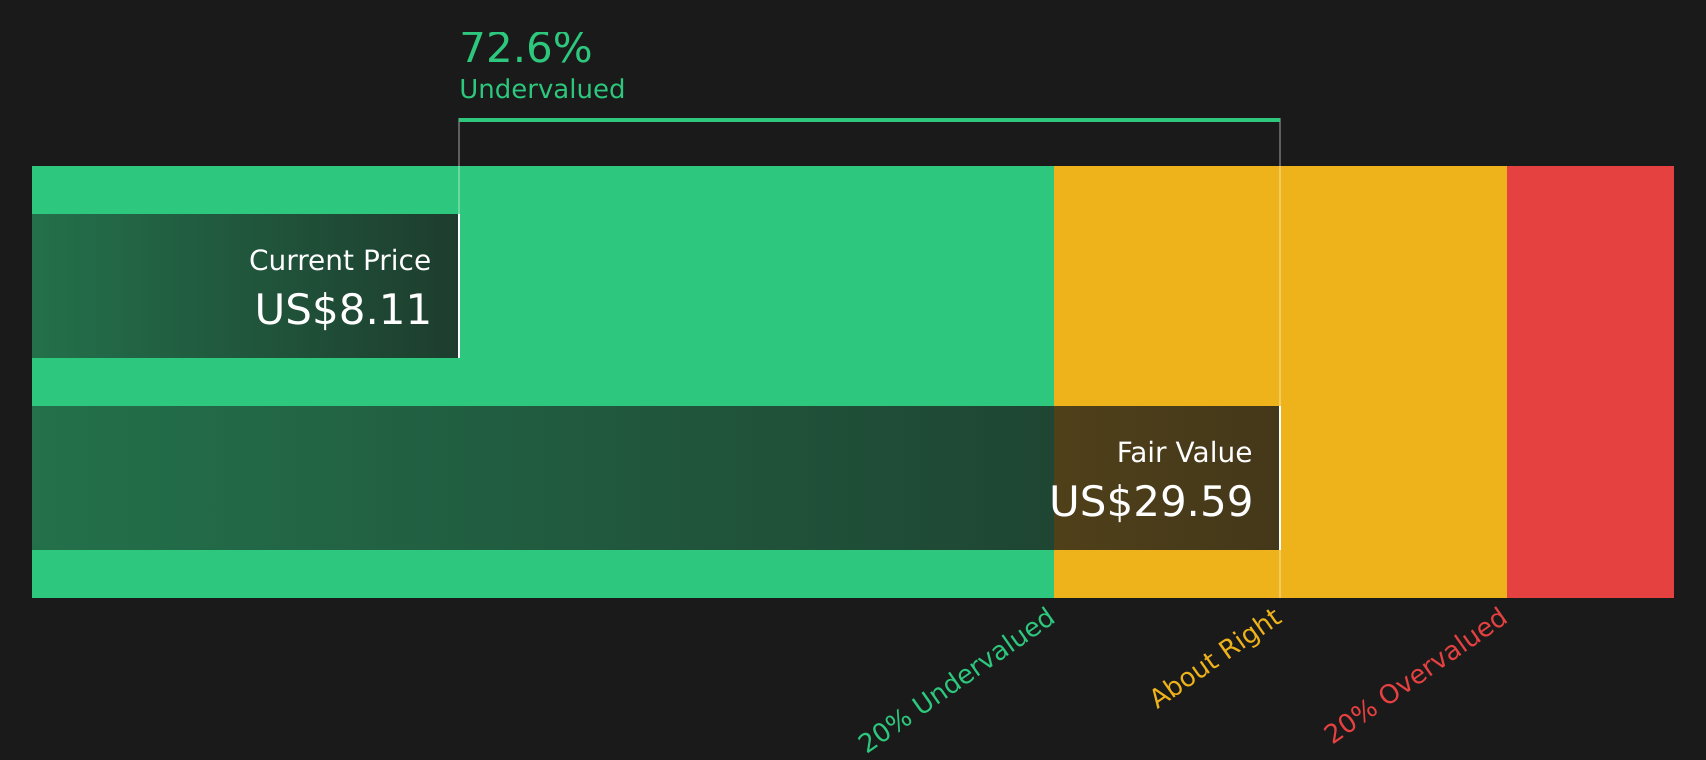
When all of those projected cash flows are discounted back and summed, the model arrives at an estimated intrinsic value of US$34.62 per share. Compared with the recent share price of US$7.79, this DCF implies the stock trades at a 77.5% discount to that estimate. This points to a wide valuation gap on this metric alone.
Result: UNDERVALUED
Our Discounted Cash Flow (DCF) analysis suggests Liberty Latin America is undervalued by 77.5%. Track this in your watchlist or portfolio, or discover 53 more high quality undervalued stocks.
Approach 2: Liberty Latin America Price vs Sales
For a business like Liberty Latin America, where earnings can be influenced by interest, taxes and accounting choices, the P/S ratio is a useful way to compare the value investors are placing on each dollar of revenue.
In general, higher growth expectations and lower perceived risk can justify a higher P/S multiple, while slower expected growth and higher risk usually line up with a lower, more conservative multiple.
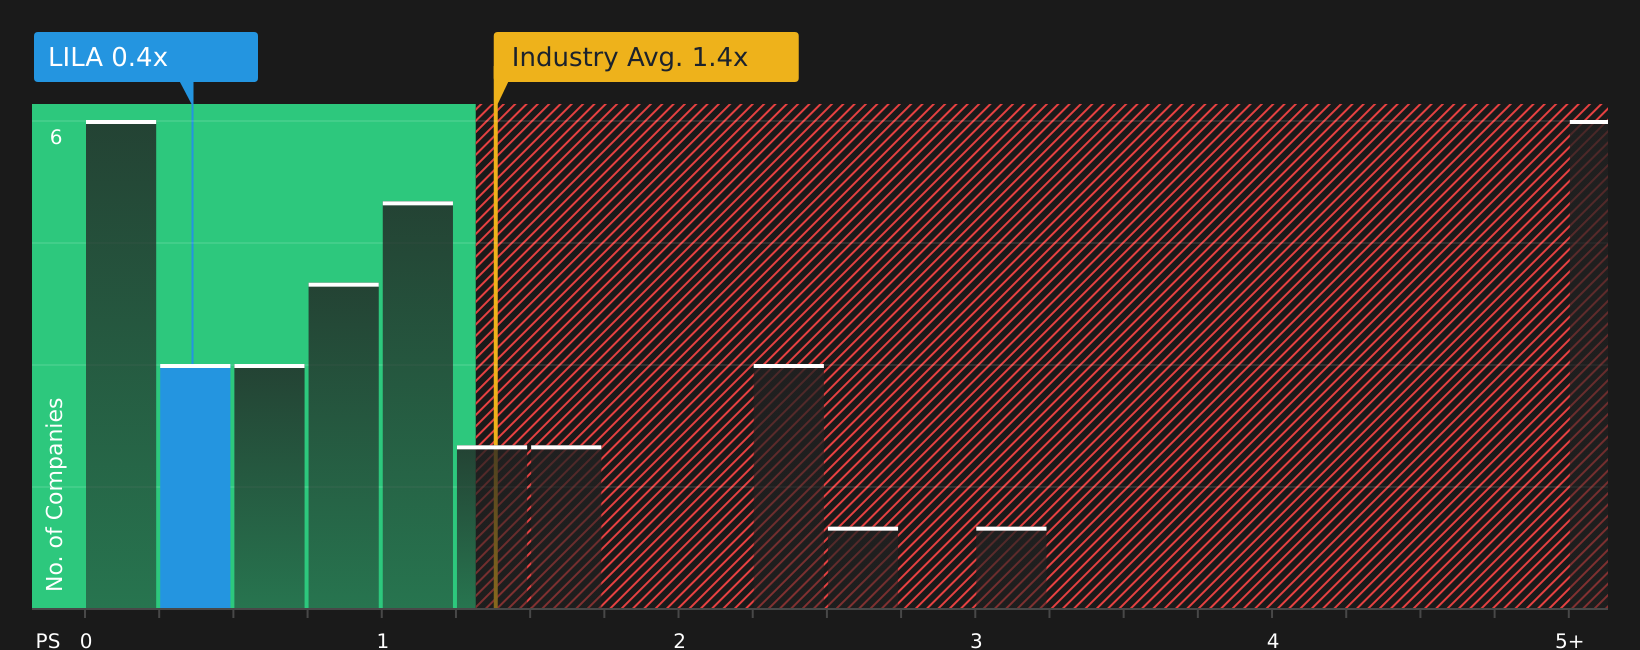
Liberty Latin America currently trades on a P/S ratio of 0.35x. That sits well below the Telecom industry average of 1.38x and also below the peer group average of 1.95x. On those simple comparisons alone, the shares screen as cheap relative to sector and peers.
Simply Wall St’s Fair Ratio for the company is 1.66x. This is a proprietary estimate of what a “normal” P/S might look like for Liberty Latin America once you factor in its growth profile, industry, profit margin, size and key risks.
This Fair Ratio is more tailored than a straight industry or peer comparison because it adjusts for company specific characteristics instead of assuming all telecoms deserve the same multiple.
When set against the current 0.35x P/S, the 1.66x Fair Ratio indicates that the shares may be undervalued on this metric.
Result: UNDERVALUED
P/S ratios tell one story, but what if the real opportunity lies elsewhere? Start investing in legacies, not executives. Discover our 21 top founder-led companies.
Upgrade Your Decision Making: Choose your Liberty Latin America Narrative
Earlier we mentioned that there is an even better way to think about valuation. On Simply Wall St you can use Narratives, where you set out a clear story for Liberty Latin America, link that story to specific forecasts for revenue, earnings and margins, and arrive at your own Fair Value that updates automatically when new news or earnings are released. You can then compare that Fair Value to today’s price to decide whether the stock looks attractive or not. Different investors on the Community page are already expressing very different views, from a cautious US$6.00 Fair Value that leans on slower 1.9% revenue growth, a 5.3% margin and a 6.9x P/E, through to a more optimistic US$14.90 Fair Value that assumes 4.0% revenue growth, a 6.5% margin and a 13.3x P/E, all for the same company.
Do you think there's more to the story for Liberty Latin America? Head over to our Community to see what others are saying!

This article by Simply Wall St is general in nature. We provide commentary based on historical data and analyst forecasts only using an unbiased methodology and our articles are not intended to be financial advice. It does not constitute a recommendation to buy or sell any stock, and does not take account of your objectives, or your financial situation. We aim to bring you long-term focused analysis driven by fundamental data. Note that our analysis may not factor in the latest price-sensitive company announcements or qualitative material. Simply Wall St has no position in any stocks mentioned.
Have feedback on this article? Concerned about the content? Get in touch with us directly. Alternatively, email editorial-team@simplywallst.com