
- LIVE QUOTES
- LEARN
- HELP
 Nasdaq
 Wall Street Journal
EN
Is It Too Late To Consider Williams Sonoma (WSM) After Its Multi Year Share Price Surge
- If you are trying to figure out whether Williams-Sonoma is still reasonably priced after a strong multi year run, starting with a clear look at valuation can help ground your view before you act.
- The stock last closed at US$208.97, with returns of 2.2% over 30 days, 11.2% year to date and 8.1% over 1 year, while the 3 year and 5 year returns are both very large.
- Recent headlines have focused on Williams-Sonoma's positioning in home furnishings and its brand strength with higher income consumers, which can influence how investors think about the resilience of demand. There has also been attention on its omni channel model and ongoing cost discipline, factors that often shape how the market prices retailers of this size.
- Our framework currently gives Williams-Sonoma a value score of 2 out of 6. In this article we will look at what different valuation approaches say about the stock, then finish by highlighting a more holistic way to judge value that many investors overlook.
Williams-Sonoma scores just 2/6 on our valuation checks. See what other red flags we found in the full valuation breakdown.
Approach 1: Williams-Sonoma Discounted Cash Flow (DCF) Analysis
A Discounted Cash Flow, or DCF, model estimates what a business could be worth by projecting its future cash flows and then discounting those back to today using a required rate of return. It is essentially asking what those future dollars are worth in your pocket right now.
For Williams-Sonoma, the model used is a 2 Stage Free Cash Flow to Equity approach based on cash flow projections. The latest twelve month free cash flow is about $1.11b. Analysts provide specific free cash flow estimates through 2028, such as $1,300m for the year ending 2028, and Simply Wall St extrapolates further out to 2035, with projected free cash flow figures ranging from about $1,014m in 2026 to around $1,766m in 2035, all expressed in dollar terms.
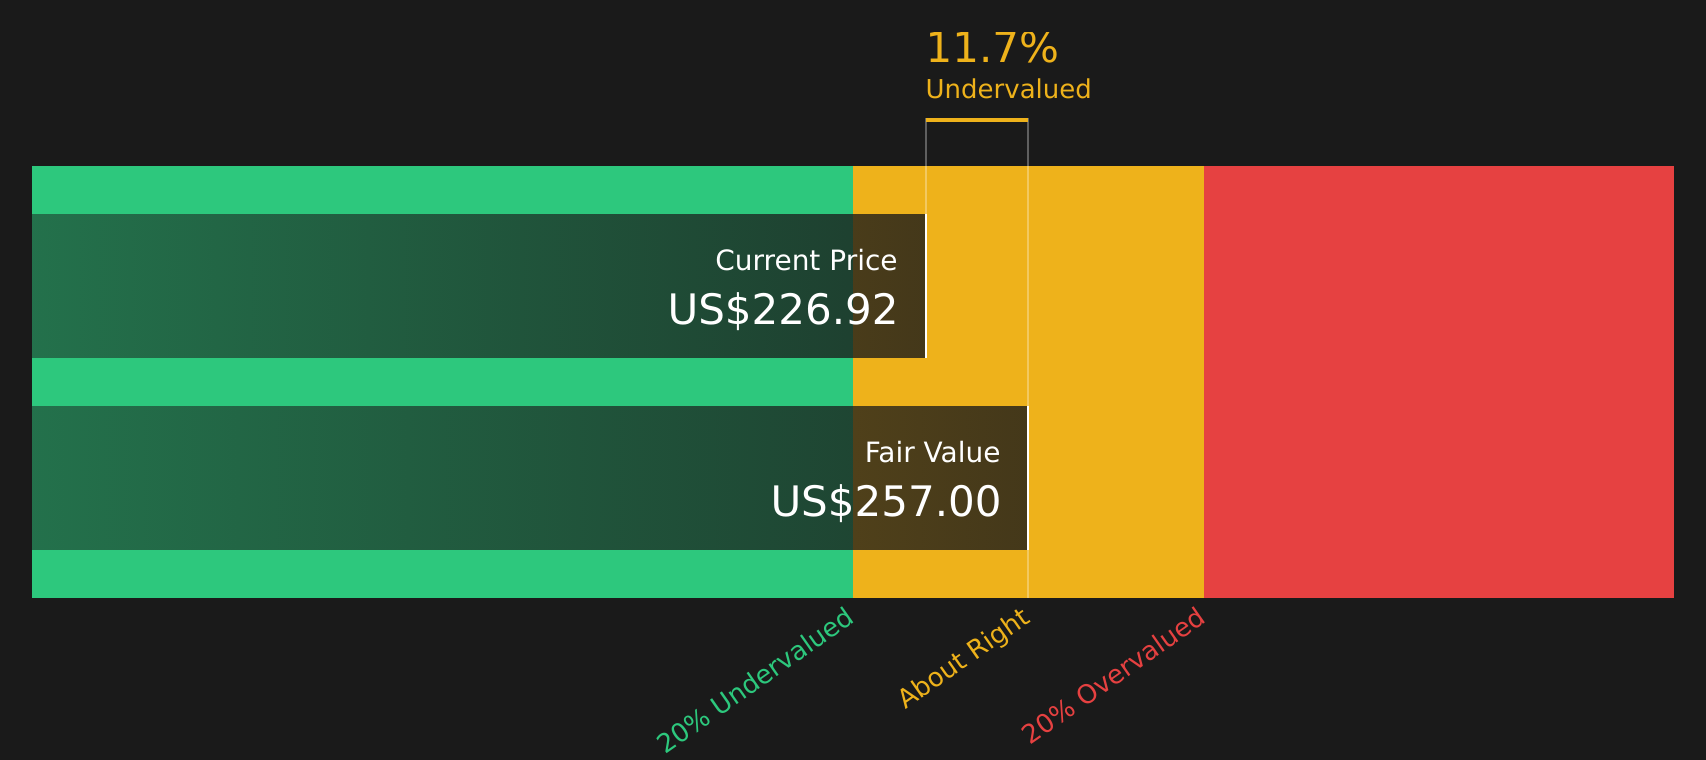
After discounting these projected cash flows, the model produces an estimated intrinsic value of US$216.55 per share. Compared with the recent share price of US$208.97, the DCF implies the stock trades at about a 3.5% discount, which is a relatively small gap.
Result: ABOUT RIGHT
Williams-Sonoma is fairly valued according to our Discounted Cash Flow (DCF), but this can change at a moment's notice. Track the value in your watchlist or portfolio and be alerted on when to act.
Approach 2: Williams-Sonoma Price vs Earnings
For a profitable company like Williams-Sonoma, the P/E ratio is a useful way to see what you are paying for each dollar of current earnings. Investors usually accept a higher P/E when they expect stronger growth or view the business as lower risk, while slower growth or higher risk tends to justify a lower multiple.
Williams-Sonoma currently trades on a P/E of 22.1x. That sits above the Specialty Retail industry average P/E of about 20.6x and below the peer group average of 24.7x. Simply Wall St also calculates a proprietary “Fair Ratio” for Williams-Sonoma of 17.0x, which is the P/E level suggested by factors such as its earnings profile, margins, industry, market cap and risk characteristics.
The Fair Ratio gives you a more tailored reference point than a simple comparison with industry or peers, because it adjusts for company specific traits instead of assuming every retailer deserves the same multiple. Setting the current P/E of 22.1x against the Fair Ratio of 17.0x indicates that the shares are trading above that model-based reference level.
Result: OVERVALUED

P/E ratios tell one story, but what if the real opportunity lies elsewhere? Start investing in legacies, not executives. Discover our 22 top founder-led companies.
Upgrade Your Decision Making: Choose your Williams-Sonoma Narrative
Earlier we mentioned that there is an even better way to understand valuation. On Simply Wall St's Community page, you can use Narratives to write your own Williams-Sonoma story, link that story to specific assumptions for future revenue, earnings and margins, turn those into a Fair Value, and then compare that Fair Value with the current price to decide whether you see the stock as attractive or not. The highest Williams-Sonoma Narrative on the platform currently points to a Fair Value of about US$250 per share, and the lowest is around US$155. Both update automatically when new news or earnings are added so your view stays tied to the latest information.
For Williams-Sonoma however we will make it really easy for you with previews of two leading Williams-Sonoma Narratives:
Fair value in this bullish narrative: US$250.00 per share
Implied undervaluation vs last close of US$208.97: about 16.5%
Assumed annual revenue growth: 4.8%
- Backers of this view focus on Williams-Sonoma’s e commerce strength, omni channel model and in house brands like Pottery Barn, West Elm and Rejuvenation as key supports for margins and brand power.
- They also point to demographic trends, sustainability efforts and supply chain improvements, including more U.S. based manufacturing, as supports for steady growth and earnings resilience.
- To line up with this fair value, you would need to be comfortable with earnings reaching about US$1.2b by 2028 and the shares trading on a higher P/E multiple than today, supported by ongoing buybacks.
Fair value in this bearish narrative: US$155.01 per share
Implied overvaluation vs last close of US$208.97: about 34.8%
Assumed annual revenue growth: 3.6%
- Supporters of this view pay close attention to tariff risks, modest revenue assumptions and the reliance on inventory tactics, which they see as potential pressure points for margins and working capital.
- They highlight that, in this scenario, earnings sit closer to current levels and the P/E multiple compresses over time, even with ongoing buybacks and operational efficiencies.
- To agree with this fair value, you would need to think that the current valuation already prices in a lot of execution risk and that a lower multiple on roughly flat earnings is more realistic.
If you want to see these Williams-Sonoma stories in full and judge which one feels closer to your own expectations, Curious how numbers become stories that shape markets? Explore Community Narratives can help you compare the underlying assumptions directly with the current share price.
Do you think there's more to the story for Williams-Sonoma? Head over to our Community to see what others are saying!

This article by Simply Wall St is general in nature. We provide commentary based on historical data and analyst forecasts only using an unbiased methodology and our articles are not intended to be financial advice. It does not constitute a recommendation to buy or sell any stock, and does not take account of your objectives, or your financial situation. We aim to bring you long-term focused analysis driven by fundamental data. Note that our analysis may not factor in the latest price-sensitive company announcements or qualitative material. Simply Wall St has no position in any stocks mentioned.
Have feedback on this article? Concerned about the content? Get in touch with us directly. Alternatively, email editorial-team@simplywallst.com