
- LIVE QUOTES
- LEARN
- HELP
 Nasdaq
 Wall Street Journal
EN
Assessing ASML Holding (NasdaqGS:ASML) Valuation After A Strong Year Of Shareholder Returns
ASML Holding stock performance and business snapshot
ASML Holding (NasdaqGS:ASML) has drawn investor attention recently, with the share price at $1,497.80 and total returns over the past year, 3 years, and 5 years all in positive territory.
The company reports annual revenue of €32.67b and net income of €9.61b, with both revenue and earnings showing positive annual growth. ASML focuses on lithography, metrology, and inspection systems used in advanced semiconductor manufacturing.
Its equipment portfolio includes extreme ultraviolet and deep ultraviolet lithography systems, along with metrology tools and computational lithography software that support chipmakers across Asia, Europe, the Middle East, Africa, and the United States.
See our latest analysis for ASML Holding.
ASML Holding’s recent share price return of 43.89% over the past 90 days, alongside a 106.65% total shareholder return over the past year, points to strong momentum rather than a short term spike.
If you are watching the chip equipment space closely, it can be useful to see what else is moving alongside ASML, including our screener of 1 AI infrastructure stocks that may benefit from similar themes.
With ASML Holding now trading at $1,497.80 and recent returns firmly in the green, the key question is whether the current price still leaves room for upside or if the market is already pricing in future growth?
Price-to-Earnings of 50.8x: Is it justified?
On a simple earnings yardstick, ASML Holding’s current P/E of 50.8x at a share price of $1,497.80 sits above several key reference points. This suggests investors are paying a premium for each dollar of earnings compared with parts of the market.
The P/E ratio compares the share price to earnings per share, so a higher figure often reflects stronger growth expectations or a willingness to pay more for an established earnings profile. For a capital intensive semiconductor equipment company with high reported profitability, a richer P/E can reflect expectations that earnings forecasts are achievable and that the current earnings base is viewed as relatively resilient.
ASML is described as expensive versus the estimated fair P/E of 37.7x, which is a level the market could move toward if expectations cool. It also screens as expensive against the broader US Semiconductor industry average of 42.8x. That said, it is labelled good value compared with a peer group average P/E of 55.9x, which highlights how the market is assigning ASML a premium, but not the highest one, within its closer peer set.
Explore the SWS fair ratio for ASML Holding
Result: Price-to-Earnings of 50.8x (OVERVALUED)
However, you still need to weigh risks such as potential shifts in chip demand or changes in capital spending by major semiconductor customers that could affect expectations.
Find out about the key risks to this ASML Holding narrative.
Another View: Cash Flows Paint An Even Richer Picture
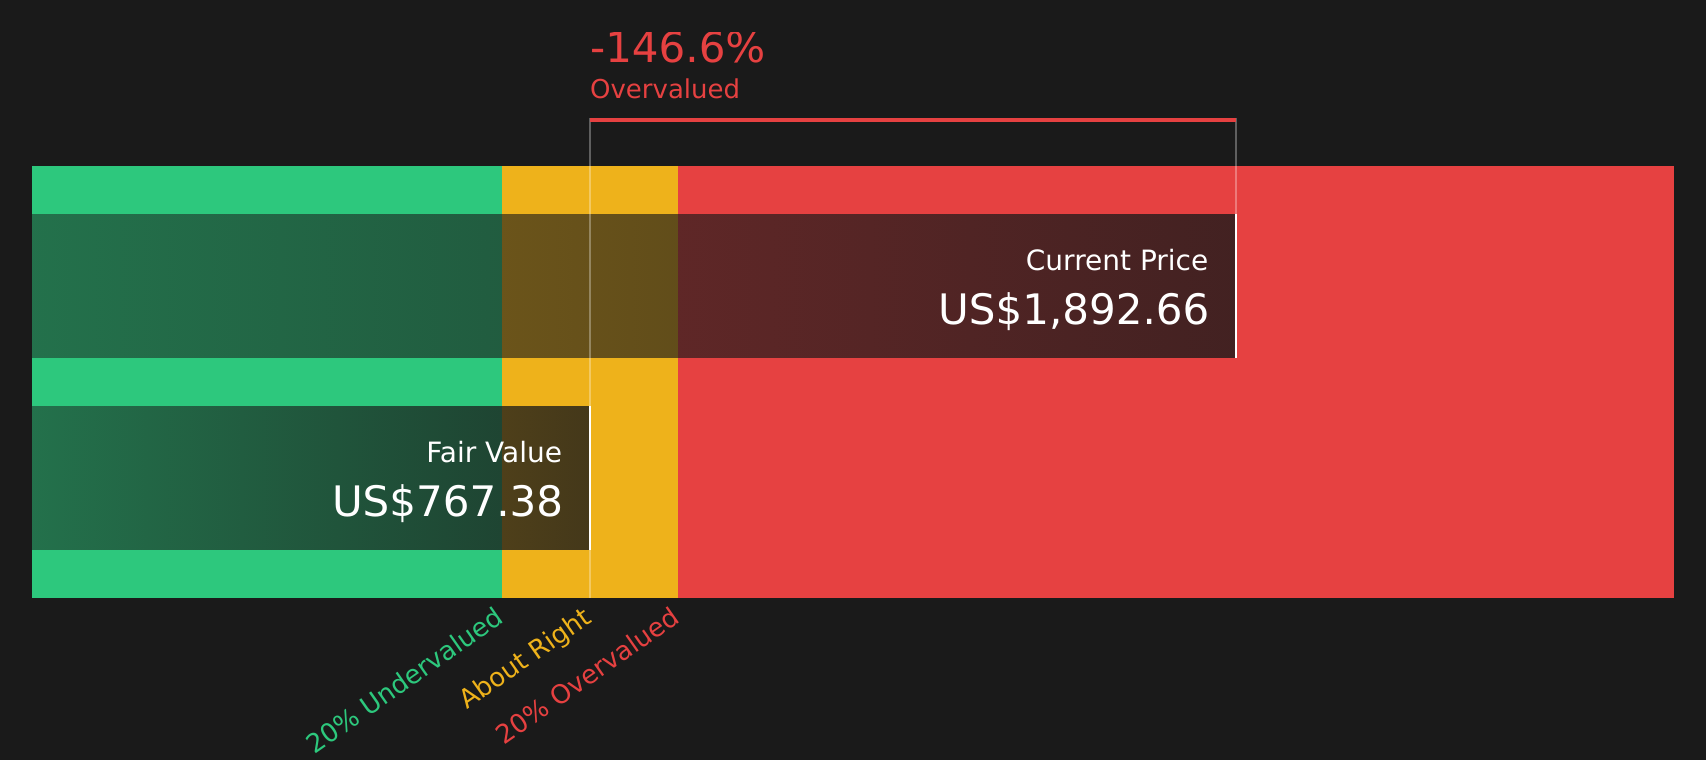
While the P/E of 50.8x already looks stretched, our DCF model goes further, with an estimated value of $836.49 per share versus the current $1,497.80. On this view, the stock screens as overvalued. This raises a key question: how much optimism are you comfortable paying for?
Look into how the SWS DCF model arrives at its fair value.
Simply Wall St performs a discounted cash flow (DCF) on every stock in the world every day (check out ASML Holding for example). We show the entire calculation in full. You can track the result in your watchlist or portfolio and be alerted when this changes, or use our stock screener to discover 51 high quality undervalued stocks. If you save a screener we even alert you when new companies match - so you never miss a potential opportunity.
Next Steps
If this all feels optimistic, now is the time to look under the hood yourself and decide how comfortable you are with that story. This includes reviewing the 2 key rewards to see what is currently driving that optimism.
Looking for more investment ideas?
If ASML feels fully priced to you, this is the moment to widen your watchlist and line up a few other ideas before the next move.
- Target quality at a discount by checking companies that pass our 51 high quality undervalued stocks and see which names currently trade below their assessed worth with solid fundamentals.
- Focus on staying power with businesses featured in our solid balance sheet and fundamentals stocks screener (41 results) to spot companies that pair financial strength with ongoing operations.
- Get ahead of the crowd by scanning our screener containing 23 high quality undiscovered gems where quietly performing companies may not yet be widely followed.
This article by Simply Wall St is general in nature. We provide commentary based on historical data and analyst forecasts only using an unbiased methodology and our articles are not intended to be financial advice. It does not constitute a recommendation to buy or sell any stock, and does not take account of your objectives, or your financial situation. We aim to bring you long-term focused analysis driven by fundamental data. Note that our analysis may not factor in the latest price-sensitive company announcements or qualitative material. Simply Wall St has no position in any stocks mentioned.
Have feedback on this article? Concerned about the content? Get in touch with us directly. Alternatively, email editorial-team@simplywallst.com