
- LIVE QUOTES
- LEARN
- HELP
 Nasdaq
 Wall Street Journal
EN
3 Undiscovered Gems in the US Market with Promising Potential
As the United States stock market kicks off February with a strong upswing, highlighted by significant gains in major indices like the Dow Jones Industrial Average and S&P 500, investors are keeping a close eye on the potential impact of trade deals and economic indicators. Amidst this backdrop of optimism and uncertainty, identifying promising small-cap stocks can be particularly rewarding as they often offer unique growth opportunities that may not yet be fully recognized by the broader market.
Top 10 Undiscovered Gems With Strong Fundamentals In The United States
| Name | Debt To Equity | Revenue Growth | Earnings Growth | Health Rating |
|---|---|---|---|---|
| Franklin Financial Services | 129.39% | 5.72% | -3.22% | ★★★★★★ |
| Tri-County Financial Group | 102.20% | -2.69% | -15.63% | ★★★★★★ |
| Sound Financial Bancorp | 16.27% | 0.75% | -13.26% | ★★★★★★ |
| Epsilon Energy | NA | 2.43% | -4.36% | ★★★★★★ |
| First Northern Community Bancorp | NA | 7.79% | 11.96% | ★★★★★★ |
| Seneca Foods | 38.64% | 2.39% | -18.65% | ★★★★★☆ |
| NameSilo Technologies | 12.63% | 14.48% | 3.12% | ★★★★★☆ |
| Pure Cycle | 5.42% | 9.36% | -2.03% | ★★★★★☆ |
| Kingstone Companies | 4.41% | 4.36% | 44.59% | ★★★★☆☆ |
| Oxford Bank | 12.42% | 14.34% | 4.14% | ★★★★☆☆ |
Let's explore several standout options from the results in the screener.
Hingham Institution for Savings (HIFS)
Simply Wall St Value Rating: ★★★★☆☆
Overview: Hingham Institution for Savings offers a range of financial services to individuals and small businesses in the United States, with a market capitalization of $689.15 million.
Operations: Hingham Institution for Savings generates revenue primarily from its financial services segment, which amounts to $102.78 million.
Hingham Institution for Savings, with total assets of US$4.5 billion and equity of US$479.7 million, showcases a robust balance sheet. Total deposits stand at US$2.5 billion while loans amount to US$3.9 billion, though the allowance for bad loans is insufficient at 0.8% of total loans. The bank's earnings surged by 93% over the past year, outpacing the industry average growth rate of 20%. With a price-to-earnings ratio of 12x below the market average and primarily low-risk funding sources comprising 63% liabilities, Hingham reflects both potential and areas needing attention in its financial health strategy.
Crawford (CRD.B)
Simply Wall St Value Rating: ★★★★☆☆
Overview: Crawford & Company offers claims management and outsourcing solutions to carriers, brokers, and corporations across multiple regions including the United States, the United Kingdom, Europe, Canada, Australia, Asia, and Latin America with a market cap of $524.89 million.
Operations: Crawford & Company generates revenue primarily from its four segments: Broadspire ($398.08 million), Platform Solutions ($153.32 million), International Operations ($438.81 million), and North America Loss Adjusting ($314.24 million).
Crawford, a nimble player in the insurance sector, is making strides with its insurtech adoption aimed at boosting claims management efficiency. This strategic move could enhance net margins and drive earnings growth. The company has seen a 62.5% rise in earnings over the past year, outpacing the industry average of 16.9%. Despite a high net debt to equity ratio of 80.4%, Crawford's interest payments are well-covered by EBIT at 4.1x coverage. With a price-to-earnings ratio of 15.8x below the US market average, Crawford presents an intriguing value proposition amidst its ongoing transformation efforts and international expansion initiatives.
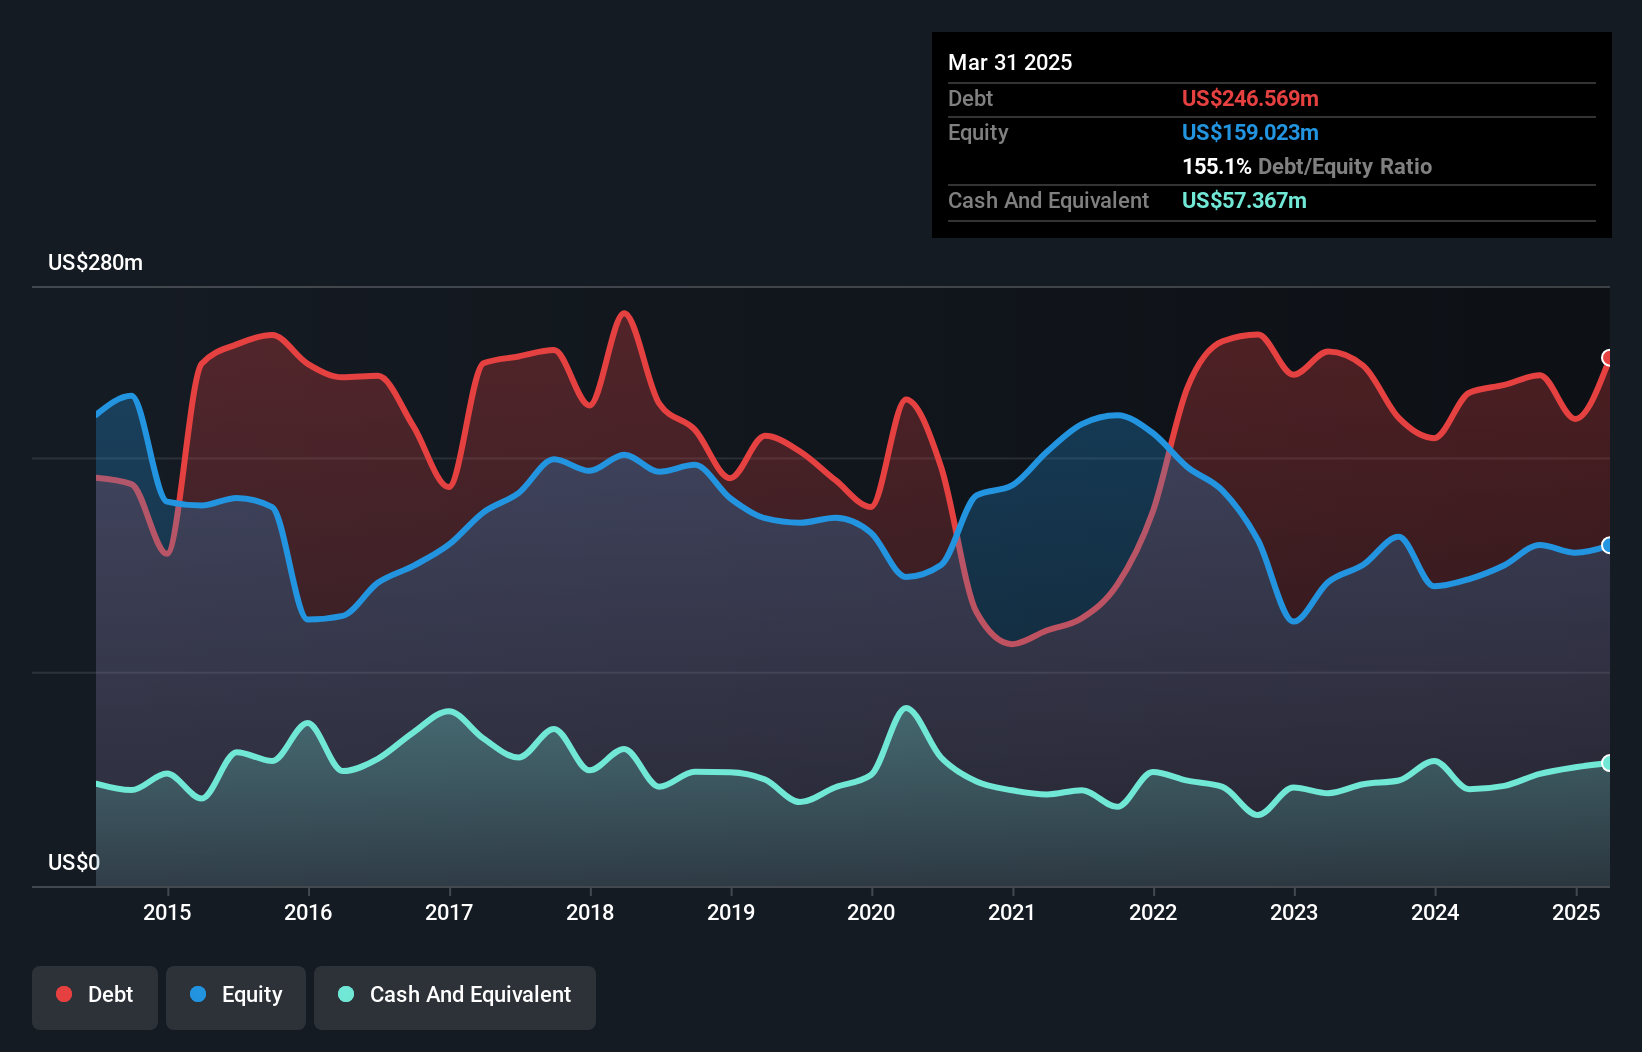
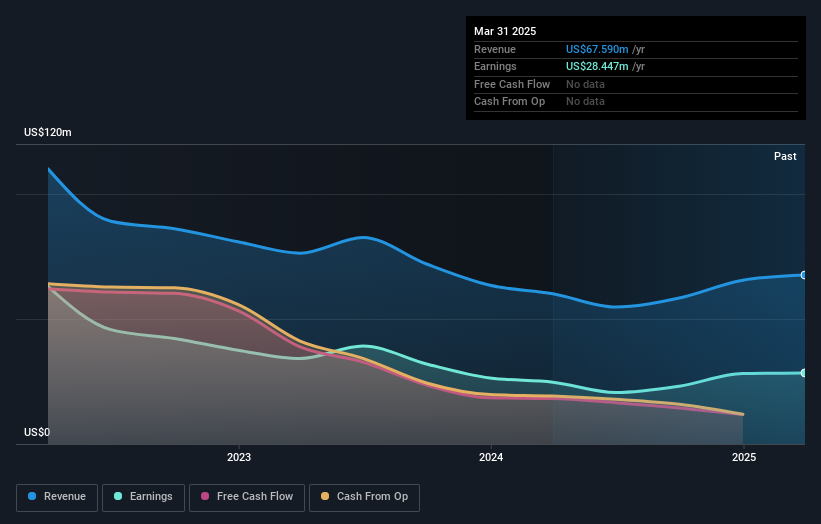
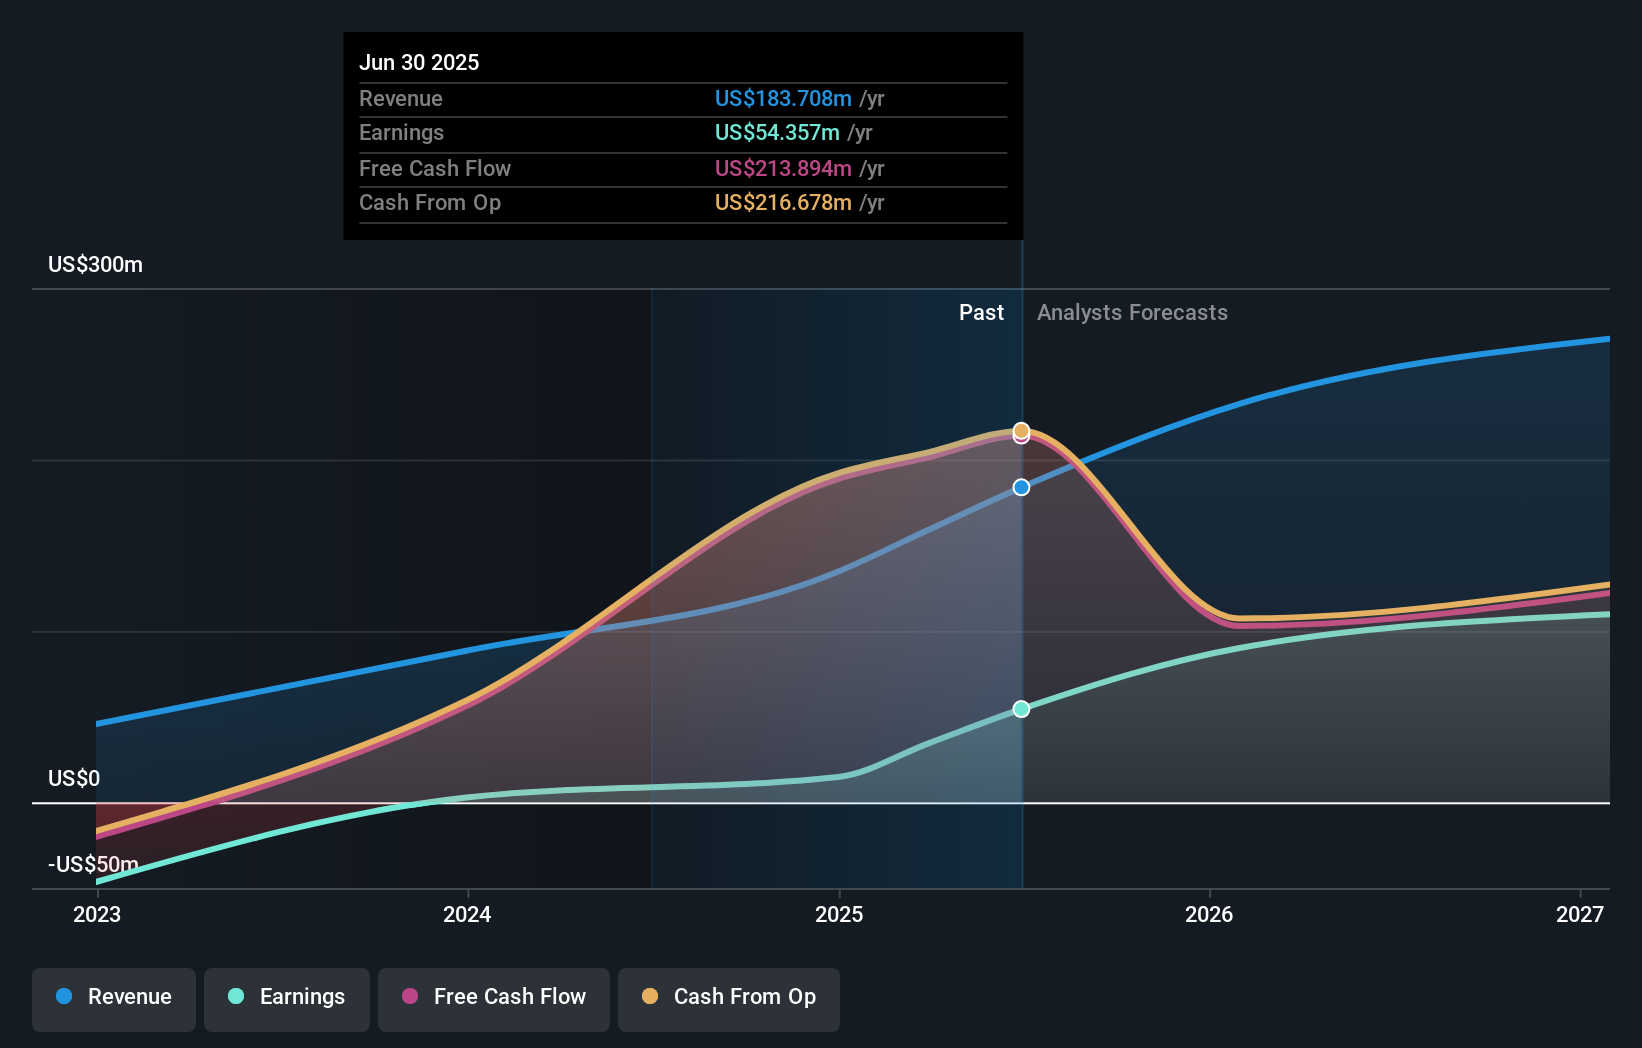
Exzeo Group (XZO)
Simply Wall St Value Rating: ★★★★★★
Overview: Exzeo Group, Inc. offers comprehensive insurance technology and operations solutions to carriers and agents, with a market capitalization of approximately $1.38 billion.
Operations: Exzeo Group generates revenue primarily from its insurance technology and operations solutions, with the Property & Casualty segment contributing $210.67 million.
Exzeo Group has demonstrated impressive earnings growth, with a 490.6% increase over the past year, significantly outpacing the Insurance industry's 16.9%. The company is debt-free, representing a remarkable turnaround from five years ago when its debt to equity ratio was 182.3%. Recent financial results show net income for Q3 2025 at US$21.15 million, up from US$5.26 million in the same period last year, reflecting high-quality earnings and positive free cash flow of US$295 million as of February 2026. These factors suggest robust financial health and potential for continued growth in profitability.
- Dive into the specifics of Exzeo Group here with our thorough health report.
Gain insights into Exzeo Group's historical performance by reviewing our past performance report.
Summing It All Up
- Click this link to deep-dive into the 318 companies within our US Undiscovered Gems With Strong Fundamentals screener.
- Already own these companies? Link your portfolio to Simply Wall St and get alerts on any new warning signs to your stocks.
- Enhance your investing ability with the Simply Wall St app and enjoy free access to essential market intelligence spanning every continent.
Ready To Venture Into Other Investment Styles?
- Explore high-performing small cap companies that haven't yet garnered significant analyst attention.
- Fuel your portfolio with companies showing strong growth potential, backed by optimistic outlooks both from analysts and management.
- Find companies with promising cash flow potential yet trading below their fair value.
This article by Simply Wall St is general in nature. We provide commentary based on historical data and analyst forecasts only using an unbiased methodology and our articles are not intended to be financial advice. It does not constitute a recommendation to buy or sell any stock, and does not take account of your objectives, or your financial situation. We aim to bring you long-term focused analysis driven by fundamental data. Note that our analysis may not factor in the latest price-sensitive company announcements or qualitative material. Simply Wall St has no position in any stocks mentioned.
Have feedback on this article? Concerned about the content? Get in touch with us directly. Alternatively, email editorial-team@simplywallst.com