
- LIVE QUOTES
- LEARN
- HELP
 Nasdaq
 Wall Street Journal
EN
Is DICK'S Sporting Goods (DKS) Pricing Make Sense After Foot Locker Deal And Mixed Valuation Signals
- If you are wondering whether DICK'S Sporting Goods is priced attractively right now, it helps to step back and look at what the recent share performance and fundamentals are really telling you.
- The stock last closed at US$202.81, with a 0.8% decline over 7 days, a 5.8% decline over 30 days, a 1.3% gain year to date, and a 10.1% decline over the past year, set against longer-term returns of 68.9% over 3 years and 214.0% over 5 years.
- Recent headlines around DICK'S Sporting Goods have focused on the company’s position within US retail and investor sentiment toward consumer discretionary spending. This helps frame these mixed return figures. Together, this news flow and the share price path give useful context before you weigh what the stock might be worth today.
- On our valuation checks, DICK'S Sporting Goods scores 3 out of 6. Next, we will look at how different valuation methods line up on the stock and why a more complete approach to understanding value can matter even more by the end of this article.
Find out why DICK'S Sporting Goods's -10.1% return over the last year is lagging behind its peers.
Approach 1: DICK'S Sporting Goods Discounted Cash Flow (DCF) Analysis
A Discounted Cash Flow model projects the cash a company could generate in the future and then discounts those cash flows back to today to estimate what the business might be worth now.
For DICK'S Sporting Goods, the latest twelve month Free Cash Flow is about US$293.0 million. Using a 2 Stage Free Cash Flow to Equity model, analysts and extrapolated estimates feed in projected cash flows, including a forecast Free Cash Flow of US$472.5 million in 2035. Simply Wall St notes that analyst inputs typically extend only a few years, with later years such as 2028 to 2035 extrapolated from earlier trends.
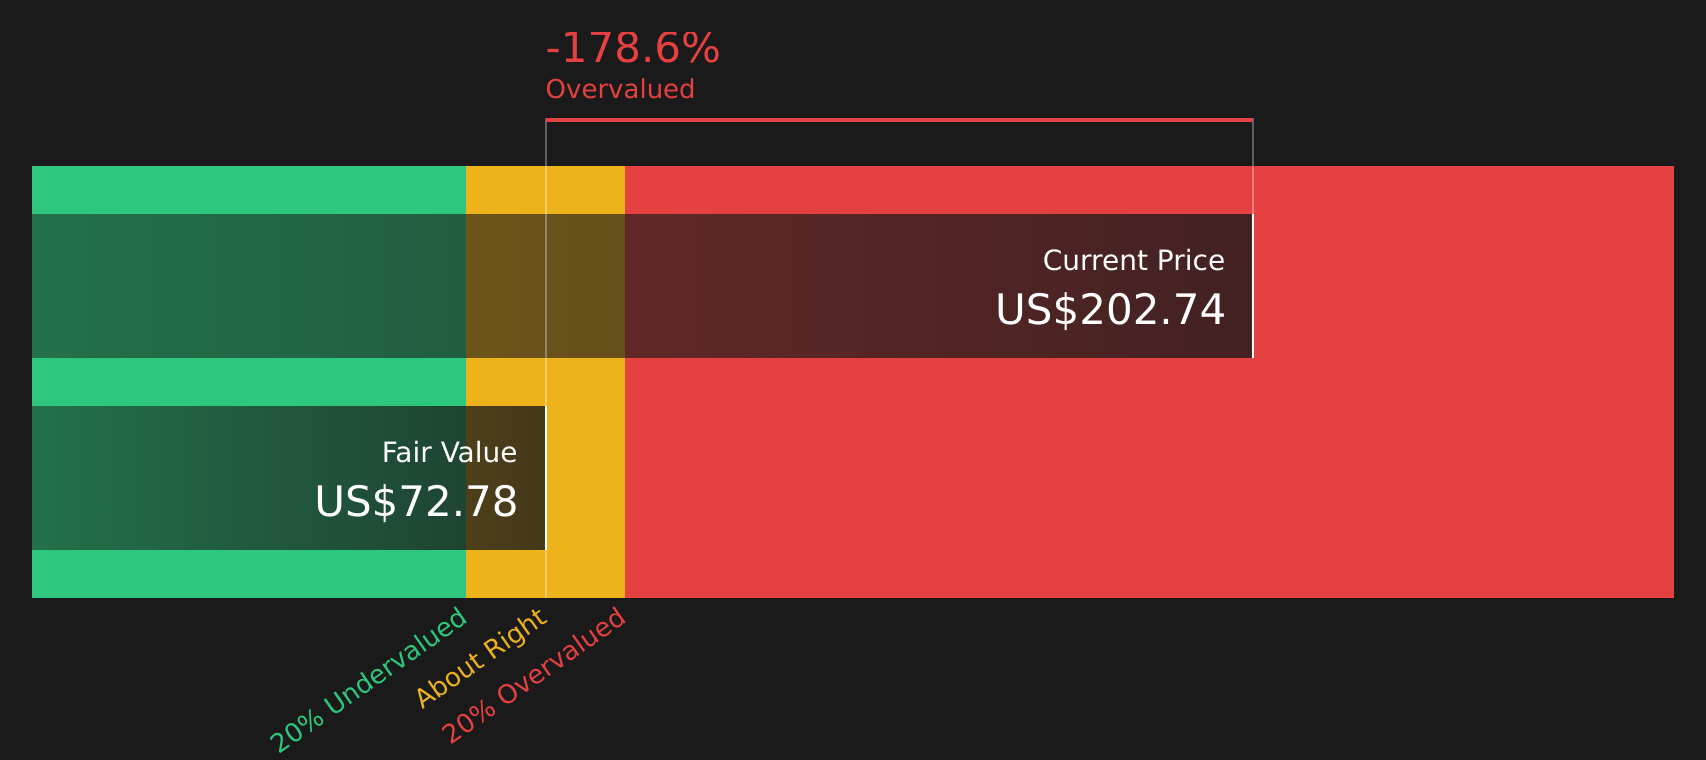
On this basis, the model arrives at an estimated intrinsic value of about US$73.36 per share. Against the recent share price of US$202.81, this implies the stock is 176.5% above the modelled value, which flags DICK'S Sporting Goods as expensive on this DCF view alone.
Result: OVERVALUED
Our Discounted Cash Flow (DCF) analysis suggests DICK'S Sporting Goods may be overvalued by 176.5%. Discover 53 high quality undervalued stocks or create your own screener to find better value opportunities.
Approach 2: DICK'S Sporting Goods Price vs Earnings
For a profitable company like DICK'S Sporting Goods, the P/E ratio is a useful way to see how much you are paying for each dollar of current earnings. It lets you quickly compare what the market is willing to pay for this business versus others with similar earnings profiles.
What counts as a “normal” P/E depends a lot on how the market views a company’s growth potential and risk. Higher expected growth and lower perceived risk can support a higher P/E, while slower growth or higher risk usually point to a lower, more conservative multiple.
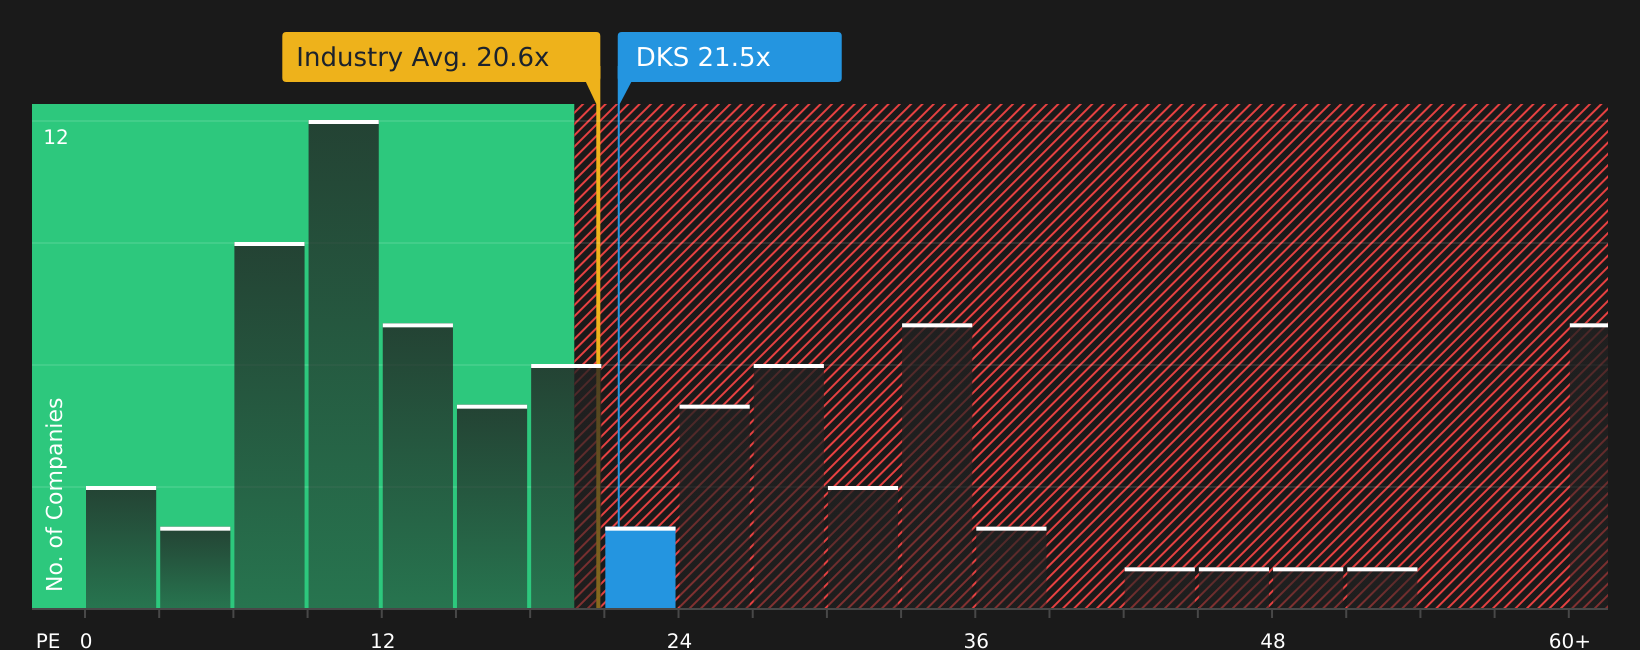
DICK'S Sporting Goods currently trades on about 17.9x earnings. That sits below the Specialty Retail industry average of about 21.5x and well below the peer group average of around 34.5x. Simply Wall St’s Fair Ratio for the stock is 20.7x, which is its proprietary view of what a reasonable P/E could be after looking at factors such as earnings growth, industry, profit margins, market cap and key risks. This tailored Fair Ratio can be more informative than a simple peer or industry comparison because it adjusts for the company’s own profile. With the current 17.9x P/E below the 20.7x Fair Ratio, the shares screen as undervalued on this measure.
Result: UNDERVALUED
P/E ratios tell one story, but what if the real opportunity lies elsewhere? Start investing in legacies, not executives. Discover our 22 top founder-led companies.
Upgrade Your Decision Making: Choose your DICK'S Sporting Goods Narrative
Earlier we mentioned that there is an even better way to think about valuation, so let us introduce Narratives, which let you connect your own story about DICK'S Sporting Goods to specific assumptions for future revenue, earnings, margins and a Fair Value estimate, then compare that Fair Value to today’s price to see whether you think it is time to buy, hold or sell.
On Simply Wall St’s Community page, millions of investors use Narratives as an accessible tool that ties a company’s story to a forecast and then to a Fair Value, which updates automatically as fresh news, earnings and other data are added. This allows your view to evolve without you rebuilding a model from scratch.
For example, one DICK'S Sporting Goods Narrative might lean closer to a bullish view that uses assumptions consistent with a Fair Value near US$285, while another might reflect a more cautious stance closer to US$199. Seeing those side by side helps you decide which story and set of numbers you personally find more realistic.
For DICK'S Sporting Goods however we will make it really easy for you with previews of two leading DICK'S Sporting Goods Narratives:
🐂 DICK'S Sporting Goods Bull Case
Fair value: US$237.24 per share
Gap to this fair value: the current US$202.81 share price is about 14.5% below this narrative’s fair value estimate
Implied future revenue growth used in this view: 15.85%
- Backers of this view focus on core margin strength, inventory clean up and ongoing demand for health, fitness and youth sports as key supports for future earnings.
- They point to omnichannel investments, in house brands, technology and the planned Foot Locker acquisition as potential drivers of revenue, margins and operating leverage.
- They also highlight execution risks around Foot Locker, higher fixed costs, rising spending and a mixed consumer backdrop, which they factor into a fair value near the analyst consensus of about US$237.
🐻 DICK'S Sporting Goods Bear Case
Fair value: US$198.60 per share
Gap to this fair value: the current US$202.81 share price is about 2.1% above this narrative’s fair value estimate
Implied future revenue growth used in this view: 3.05%
- This more cautious view focuses on heavy spending on House of Sport expansion, marketing and technology that might weigh on margins if revenue does not keep pace.
- It assumes footwear led growth, higher inventory and large capital expenditure, dividends and buybacks could strain cash flows and leave earnings sensitive to any shortfall against sales targets.
- Supporters of this narrative anchor on a fair value of about US$198.60, which aligns with a bearish analyst cohort that still sees the shares as roughly fairly priced around today’s level.
Taken together, these Narratives show how different assumptions on growth, margins and capital spending can lead to different views on what DICK'S Sporting Goods might be worth. If you want to see how other investors are joining the dots between these stories, it is worth spending some time with the full range of community views and valuation work.
Do you think there's more to the story for DICK'S Sporting Goods? Head over to our Community to see what others are saying!

This article by Simply Wall St is general in nature. We provide commentary based on historical data and analyst forecasts only using an unbiased methodology and our articles are not intended to be financial advice. It does not constitute a recommendation to buy or sell any stock, and does not take account of your objectives, or your financial situation. We aim to bring you long-term focused analysis driven by fundamental data. Note that our analysis may not factor in the latest price-sensitive company announcements or qualitative material. Simply Wall St has no position in any stocks mentioned.
Have feedback on this article? Concerned about the content? Get in touch with us directly. Alternatively, email editorial-team@simplywallst.com