
- LIVE QUOTES
- LEARN
- HELP
 Nasdaq
 Wall Street Journal
EN
Is It Too Late To Consider Simpson Manufacturing (SSD) After Strong Multi‑Year Share Gains?
- If you are wondering whether Simpson Manufacturing at around US$206 a share still offers value or is looking expensive, you are not alone.
- The stock has recently posted returns of 0.1% over 7 days, 9.5% over 30 days, 25.1% year to date and 17.5% over 1 year, with longer term figures of 96.2% over 3 years and 117.6% over 5 years that can influence how investors think about upside and risk.
- Recent coverage has focused on Simpson Manufacturing as a long established construction products supplier, with attention on how its connectors and structural systems fit into residential and non residential building activity. This context helps frame why investors may be reassessing what they are willing to pay for each dollar of the company’s cash flows and assets.
- On our simple valuation check framework, Simpson Manufacturing currently scores 1 out of 6. This raises fair questions about how it stacks up using different methods like DCF, multiples and asset based metrics, and we will also look at a more rounded way to think about value at the end of the article.
Simpson Manufacturing scores just 1/6 on our valuation checks. See what other red flags we found in the full valuation breakdown.
Approach 1: Simpson Manufacturing Discounted Cash Flow (DCF) Analysis
A Discounted Cash Flow model estimates what a company could be worth today by projecting its future cash flows and then discounting those cash flows back to their value in today’s dollars.
For Simpson Manufacturing, the model used is a 2 Stage Free Cash Flow to Equity approach, based on cash flow projections. The latest twelve month free cash flow is about $277.5 million. Analyst and extrapolated estimates point to free cash flow around $475.9 million in 2035, with interim projections such as $403.4 million in 2026 and $399.4 million in 2027, all discounted back to today using Simply Wall St’s assumptions.
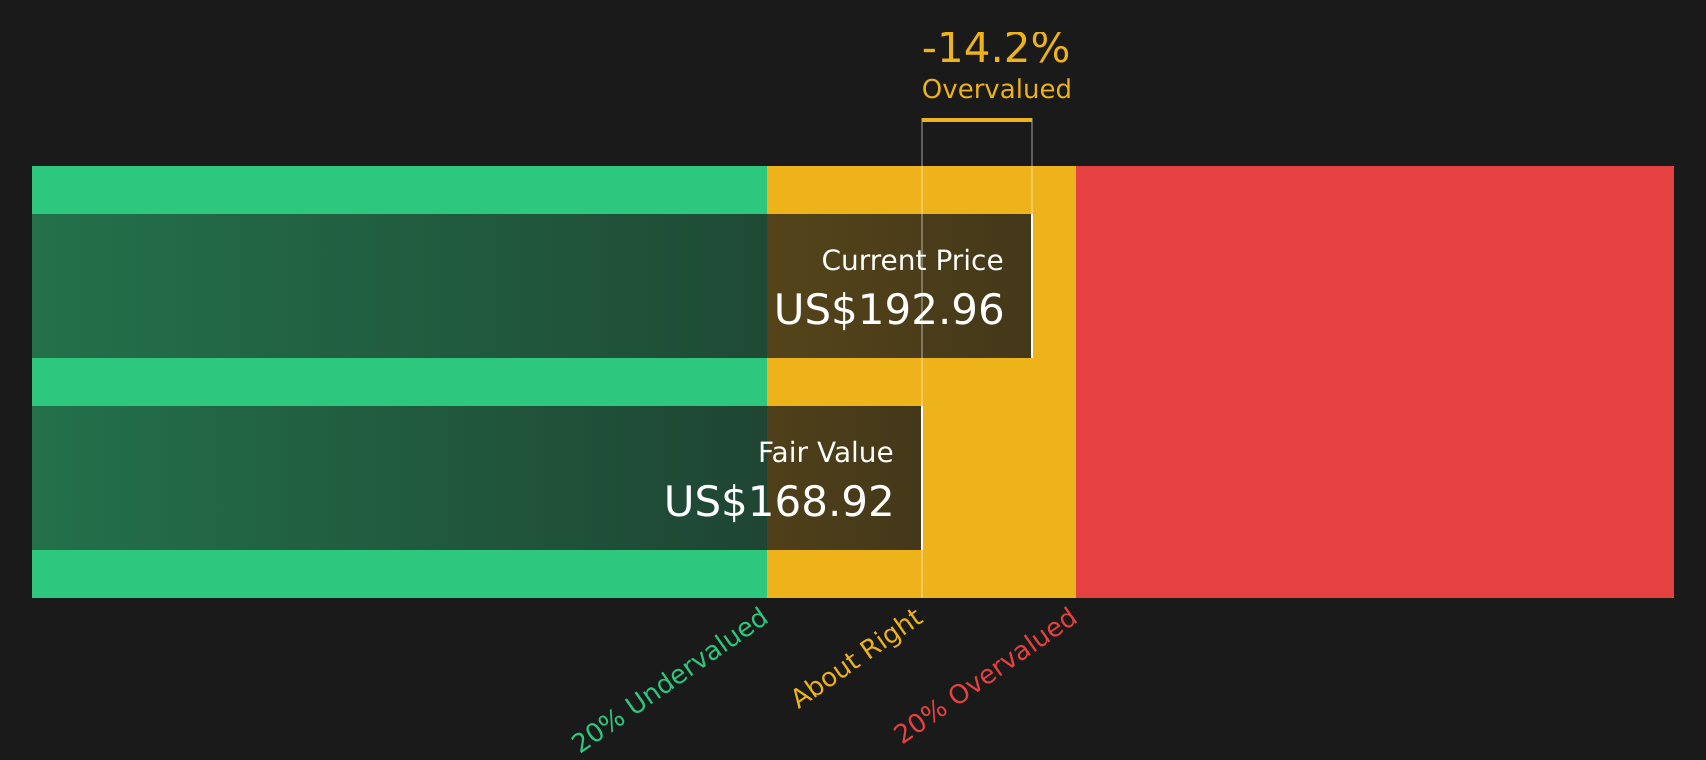
Combining these projections, the model arrives at an estimated intrinsic value of about $169.44 per share. Compared with the current share price of around $206, the DCF output suggests Simpson Manufacturing is about 21.6% overvalued on this measure.
This does not mean the stock cannot still fit certain portfolios. However, on a pure cash flow basis the price appears ahead of the model’s estimate of value.
Result: OVERVALUED
Our Discounted Cash Flow (DCF) analysis suggests Simpson Manufacturing may be overvalued by 21.6%. Discover 56 high quality undervalued stocks or create your own screener to find better value opportunities.
Approach 2: Simpson Manufacturing Price vs Earnings
For profitable companies like Simpson Manufacturing, the P/E ratio is a common way to gauge how much you are paying for each dollar of earnings. It links the share price directly to current earnings, which many investors find easier to relate to than more complex cash flow models.
What counts as a “normal” P/E typically reflects how the market views a company’s growth outlook and risks. Higher expected earnings growth or lower perceived risk can support a higher P/E, while slower growth or higher risk usually call for a lower one.
Simpson Manufacturing currently trades on a P/E of about 24.8x, compared with a Building industry average of roughly 23.1x and a peer group average of around 28.4x. Simply Wall St’s proprietary Fair Ratio for Simpson Manufacturing is 23.3x, which estimates what a suitable P/E might be given its earnings growth profile, industry, profit margins, market cap and risk factors. This Fair Ratio aims to be more tailored than a simple comparison with peers or the broad industry, because it folds in company specific drivers instead of assuming one size fits all. On this measure, Simpson Manufacturing’s actual P/E sits modestly above the Fair Ratio, which indicates that the shares may be slightly overvalued on earnings.
Result: OVERVALUED

P/E ratios tell one story, but what if the real opportunity lies elsewhere? Start investing in legacies, not executives. Discover our 23 top founder-led companies.
Upgrade Your Decision Making: Choose your Simpson Manufacturing Narrative
Earlier we mentioned that there is an even better way to understand valuation, so let us introduce you to Narratives. With Narratives, you set out your story for Simpson Manufacturing, link that story to your own revenue, earnings and margin assumptions, and then let the Simply Wall St platform turn it into a fair value you can compare with the current price. You can also track it on the Community page and see it update automatically when new earnings or news arrive. For example, one investor might build a Narrative that leans on the consensus fair value of US$194.75, revenue growth around 4.0%, profit margins near 16.0% and a future P/E of roughly 23.3x. Another might focus more heavily on housing cycle risks and come out with a lower fair value. These different Narratives give each investor a clearer framework for deciding if and when the current US$206 share price lines up with their own view.
Do you think there's more to the story for Simpson Manufacturing? Head over to our Community to see what others are saying!

This article by Simply Wall St is general in nature. We provide commentary based on historical data and analyst forecasts only using an unbiased methodology and our articles are not intended to be financial advice. It does not constitute a recommendation to buy or sell any stock, and does not take account of your objectives, or your financial situation. We aim to bring you long-term focused analysis driven by fundamental data. Note that our analysis may not factor in the latest price-sensitive company announcements or qualitative material. Simply Wall St has no position in any stocks mentioned.
Have feedback on this article? Concerned about the content? Get in touch with us directly. Alternatively, email editorial-team@simplywallst.com