
- LIVE QUOTES
- LEARN
- HELP
 Nasdaq
 Wall Street Journal
EN
Has The Recent Share Price Slump Created An Opportunity In Hub Group (HUBG)?
- If you are wondering whether Hub Group's current share price reflects its true worth, this article walks through what the numbers are saying about value today.
- The stock closed at US$39.86, with returns of an 8.2% decline over 7 days, a 15.0% decline over 30 days and a 6.8% decline year to date. The 1 year and 3 year returns are a 6.4% decline and a 12.6% decline, compared with a 45.3% gain over 5 years.
- Recent coverage has focused on Hub Group's position in transportation and logistics and how broader freight trends may be affecting sentiment around the stock. This context helps explain why some investors are reassessing the risk and return profile even without a single clear news catalyst driving the latest share price moves.
- On our valuation checks, Hub Group scores 3 out of 6 for potential undervaluation, and you can see the breakdown in our valuation score. Next we will look at how different valuation methods line up on the stock before finishing with a way to interpret value that goes beyond the usual ratios.
Find out why Hub Group's -6.4% return over the last year is lagging behind its peers.
Approach 1: Hub Group Discounted Cash Flow (DCF) Analysis
A Discounted Cash Flow, or DCF, model estimates what a business might be worth by projecting its future cash flows and then discounting them back to today’s value. It is essentially asking what all those future cash flows are worth in today’s dollars.
For Hub Group, the model uses a 2 Stage Free Cash Flow to Equity approach based on cash flows in $. The latest twelve month free cash flow is about $54.7 million. Analysts have provided forecasts for several years, and further out Simply Wall St extrapolates those estimates, resulting in projected free cash flow of about $252.5 million in 2035, with each future year discounted back to today.
Adding these discounted cash flows produces an estimated intrinsic value of about $65.96 per share. Compared with the recent share price of $39.86, the DCF implies the stock is 39.6% undervalued on these assumptions.
Result: UNDERVALUED
Our Discounted Cash Flow (DCF) analysis suggests Hub Group is undervalued by 39.6%. Track this in your watchlist or portfolio, or discover 56 more high quality undervalued stocks.

Approach 2: Hub Group Price vs Earnings
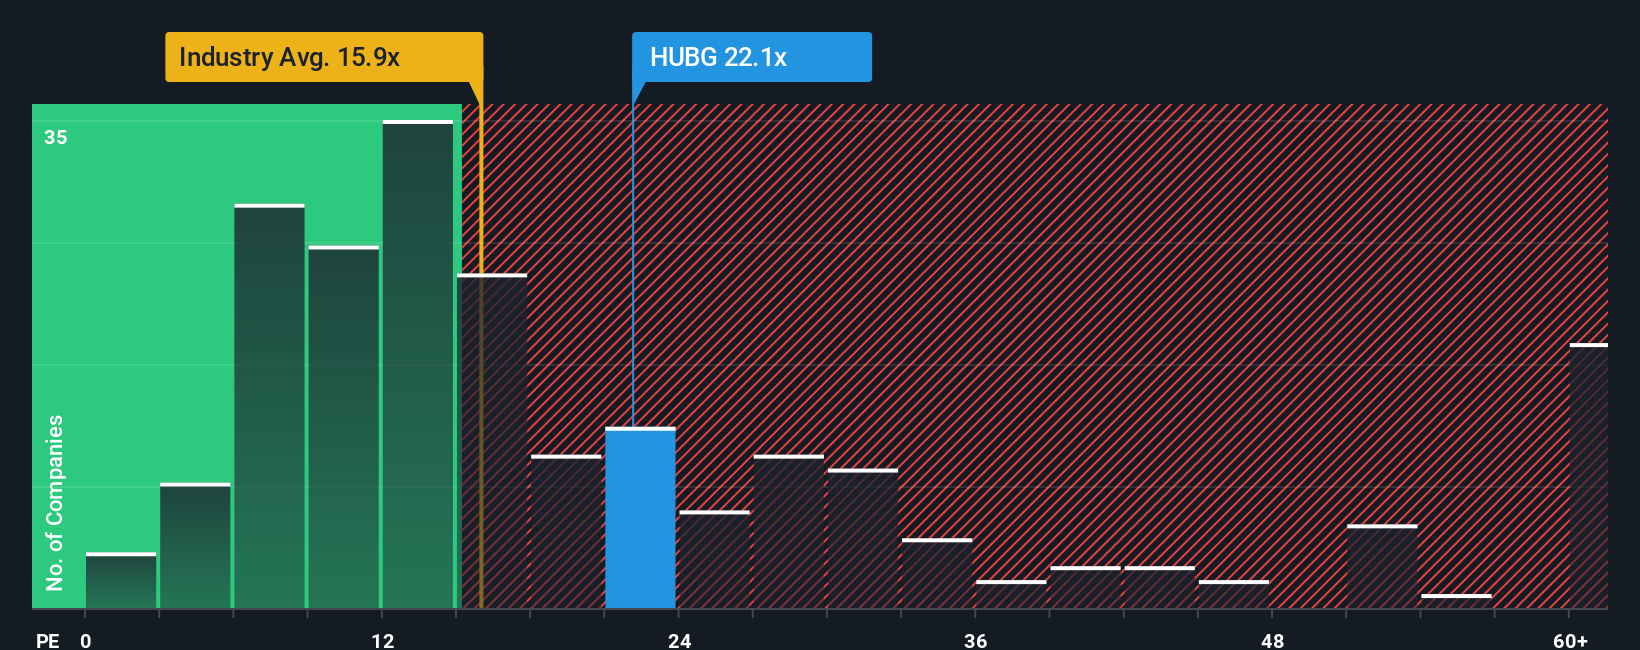
For a profitable company like Hub Group, the P/E ratio is a straightforward way to think about what you are paying for each dollar of earnings. Investors typically accept a higher P/E when they expect stronger growth or see the business as lower risk, and a lower P/E when growth expectations or perceived risk are more modest.
Hub Group currently trades on a P/E of 23.22x. That sits slightly below the peer average of 24.62x, and above the Logistics industry average of 16.49x. To go a step further, Simply Wall St calculates a Fair Ratio of 14.48x. This proprietary metric estimates the P/E that might be reasonable for Hub Group given factors such as its earnings growth profile, profit margins, size, industry and company specific risks.
Because the Fair Ratio pulls these elements together into one number, it can be a more tailored benchmark than a simple comparison with peers or the wider industry. When Hub Group’s current P/E of 23.22x is set against the Fair Ratio of 14.48x, the shares screen as trading above that modelled level.
Result: OVERVALUED
P/E ratios tell one story, but what if the real opportunity lies elsewhere? Start investing in legacies, not executives. Discover our 23 top founder-led companies.
Upgrade Your Decision Making: Choose your Hub Group Narrative
Earlier we mentioned that there is an even better way to understand valuation. On Simply Wall St's Community page you can use Narratives to write your own story for Hub Group by linking what you believe about its future revenue, earnings and margins to a financial forecast and fair value. You can then compare that fair value with the current price, see how your view sits against other Narratives that currently range from about US$36.00 to US$55.00, and watch your Narrative update automatically as new news, earnings and guidance are reflected in the numbers.
For Hub Group, however, we will make it really easy for you with previews of two leading Hub Group Narratives:
Fair value: US$45.67 per share
Implied discount to fair value: 12.7% undervalued versus the last close of US$39.86
Assumed revenue growth: 4.82% per year
- Analysts in this camp expect steady revenue and earnings growth supported by e commerce related demand, end to end logistics contracts and sustainability trends that encourage more intermodal freight.
- They also factor in margin expansion helped by cost savings, digital tools, automation and acquisitions, with buybacks and a solid balance sheet supporting the equity story.
- Key risks they highlight include freight softness, digital competition, customer concentration and higher capital and labor costs, which could weigh on margins and free cash flow if they persist.
Fair value: US$36.00 per share
Implied premium to fair value: 10.7% overvalued versus the last close of US$39.86
Assumed revenue growth: 4.76% per year
- Bearish analysts focus on execution and cycle risks, including reliance on rail merger benefits, tighter truckload capacity and acquisition synergies that may not arrive as expected.
- They see potential for muted revenue growth and pressured margins if Final Mile ramps, technology gains and restructuring efforts fall short or are offset by pricing pressure.
- This group also acknowledges that strong free cash flow, cost control and intermodal interest could invalidate a cautious view if they continue to support volumes, margins and balance sheet strength.
Between these two Narratives, you can decide which set of assumptions and risks feels closer to how you see Hub Group's future. If you want to go further, you can build your own Narrative that reflects your expectations for freight demand, margins and valuation.
Do you think there's more to the story for Hub Group? Head over to our Community to see what others are saying!

This article by Simply Wall St is general in nature. We provide commentary based on historical data and analyst forecasts only using an unbiased methodology and our articles are not intended to be financial advice. It does not constitute a recommendation to buy or sell any stock, and does not take account of your objectives, or your financial situation. We aim to bring you long-term focused analysis driven by fundamental data. Note that our analysis may not factor in the latest price-sensitive company announcements or qualitative material. Simply Wall St has no position in any stocks mentioned.
Have feedback on this article? Concerned about the content? Get in touch with us directly. Alternatively, email editorial-team@simplywallst.com