
- LIVE QUOTES
- LEARN
- HELP
 Nasdaq
 Wall Street Journal
EN
A Look At TJX Companies (TJX) Valuation As Earnings Revisions And Outperformance Draw Attention
TJX Companies (TJX) is back in focus after a fresh round of favorable earnings estimate revisions and consistent beats in recent quarters, prompting investors to reassess what the current share price already reflects.
See our latest analysis for TJX Companies.
At around US$154.46, TJX’s recent 90 day share price return of 5.93% sits alongside a modest year to date move, while the 1 year total shareholder return of 26.26% highlights how longer term holders have fared much better than shorter term traders.
If TJX’s track record has you thinking about where else consistent execution could matter, this is a good moment to broaden your search and check out 23 top founder-led companies.
So with TJX at about US$154 and sitting roughly 8% below the average analyst price target, is the market overlooking further upside here or already factoring future growth expectations into the current tag?
Most Popular Narrative: 5.9% Undervalued
With TJX last closing at $154.46 against a narrative fair value of about $164.11, the current price sits below what this widely followed view implies.
Stronger than expected and broad based growth in customer transactions across all divisions, combined with consistent above plan comp sales, signals that consumers are increasingly drawn to value focused retail options in a macro environment marked by economic uncertainty supporting ongoing revenue growth and market share gains.
To understand what supports that confidence in future revenue, earnings, and margins, and the premium multiple it assumes for an off price retailer, the full narrative lays out the numbers in detail.
Result: Fair Value of $164.11 (UNDERVALUED)
Have a read of the narrative in full and understand what's behind the forecasts.
However, you still need to weigh the risk that ongoing e commerce growth pulls spending away from TJX’s stores, or that higher labor costs squeeze margins.
Find out about the key risks to this TJX Companies narrative.
Another View: Rich P/E Signals A Very Different Story
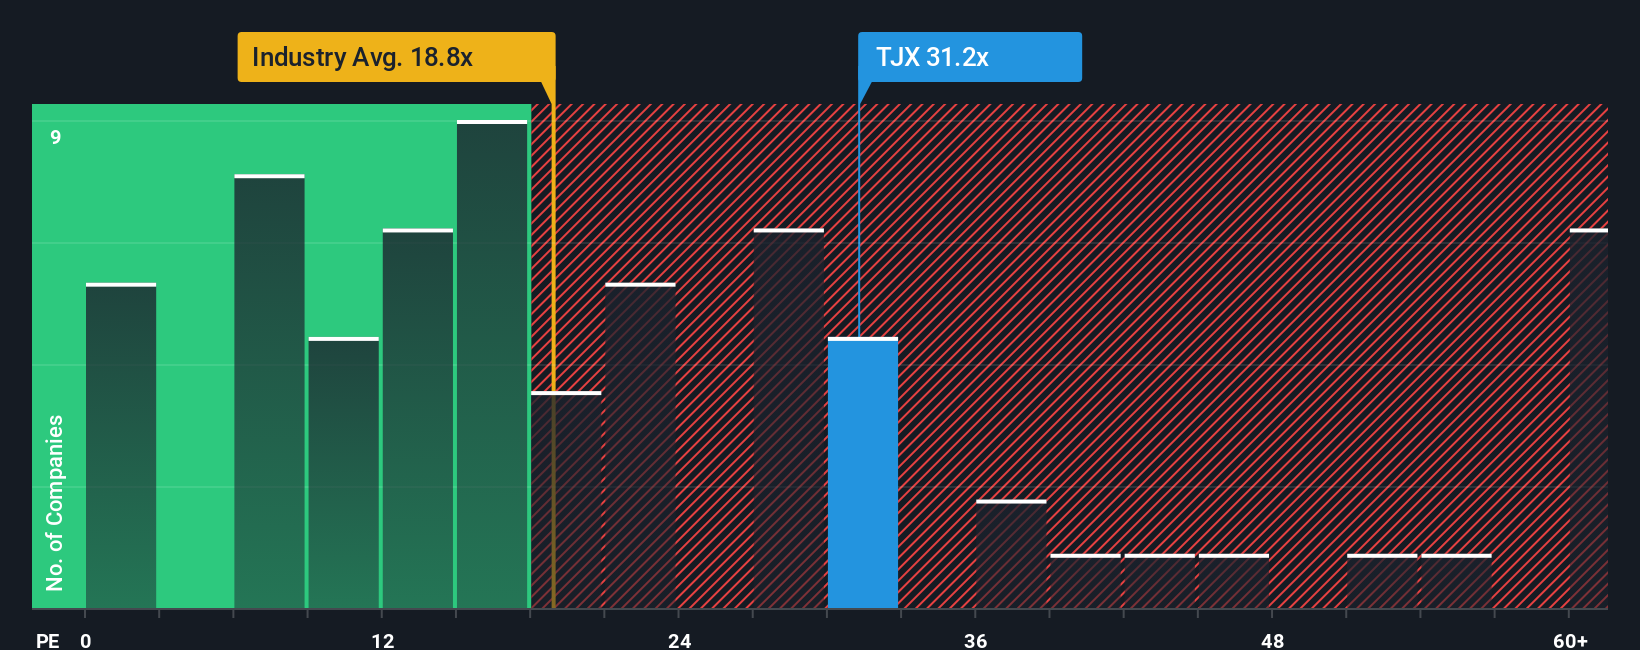
While the narrative fair value of about $164.11 points to TJX being 5.9% undervalued, the current P/E of 33.5x tells a tougher story. It sits well above the fair ratio of 23x, the US Specialty Retail average of 21.4x, and the 22.2x peer average, which raises clear valuation risk if the growth case softens.
With the price already this far ahead of those P/E markers, are you paying up for quality or simply paying too much for a story that now has less room for error?
See what the numbers say about this price — find out in our valuation breakdown.
Next Steps
If this mix of optimism and caution around TJX feels familiar, now is a good time to look at the underlying data yourself and move quickly to shape your own view. To help you weigh both sides, take a closer look at the 2 key rewards and 1 important warning sign that sit behind the current market mood.
Ready to hunt for more opportunities?
If TJX has sharpened your thinking, do not stop here. Use this momentum to scan other potential ideas before the crowd gets there first.
- Target quality at a discount by checking stocks our screener flags as 55 high quality undervalued stocks with strong fundamentals already in place.
- Strengthen your income game by zeroing in on 13 dividend fortresses that aim to pair higher yields with resilient payout histories.
- Protect your downside by focusing on 81 resilient stocks with low risk scores that combine more measured risk profiles with defensible business models.
This article by Simply Wall St is general in nature. We provide commentary based on historical data and analyst forecasts only using an unbiased methodology and our articles are not intended to be financial advice. It does not constitute a recommendation to buy or sell any stock, and does not take account of your objectives, or your financial situation. We aim to bring you long-term focused analysis driven by fundamental data. Note that our analysis may not factor in the latest price-sensitive company announcements or qualitative material. Simply Wall St has no position in any stocks mentioned.
Have feedback on this article? Concerned about the content? Get in touch with us directly. Alternatively, email editorial-team@simplywallst.com