
- LIVE QUOTES
- LEARN
- HELP
 Nasdaq
 Wall Street Journal
EN
Is Tilray Brands (TLRY) Now Priced At A Discount After Prolonged Share Price Weakness
- If you are wondering whether Tilray Brands' current share price actually lines up with its underlying value, you are not alone. This article is designed to help you frame that question clearly.
- The stock last closed at US$7.51, with returns of a 4.1% decline over 7 days, a 20.6% decline over 30 days, a 22.7% decline year to date, and a 16.1% decline over 1 year. The 3-year return stands at a 73.0% decline, which has understandably sharpened investor focus on both risk and potential upside.
- Recent coverage around Tilray Brands has largely centered on its position within the cannabis sector and how regulatory developments, capital markets sentiment, and industry consolidation conversations are shaping expectations for operators in this space. These themes are important context for the share price moves you see today because they influence how investors think about future cash flows, financing access, and where cannabis sits in a diversified portfolio.
- Tilray Brands currently scores 5 out of 6 on our valuation checks, indicating it screens as undervalued in most of the areas we look at. You can see the breakdown in our valuation score of 5/6. We will unpack this using different methods before finishing with a broader way to think about valuation beyond the usual ratios.
Find out why Tilray Brands's -16.1% return over the last year is lagging behind its peers.
Approach 1: Tilray Brands Discounted Cash Flow (DCF) Analysis
A Discounted Cash Flow, or DCF, model takes projected future cash flows and discounts them back to today to estimate what the entire business might be worth right now.
For Tilray Brands, the latest twelve month free cash flow is a loss of about $61.9 million. Analysts provide explicit free cash flow estimates for the coming years, and Simply Wall St then extends those forecasts. In this model, projected free cash flow reaches $39 million in 2030, with a series of yearly projections between 2026 and 2035 that move from negative to positive and are then extrapolated further out.
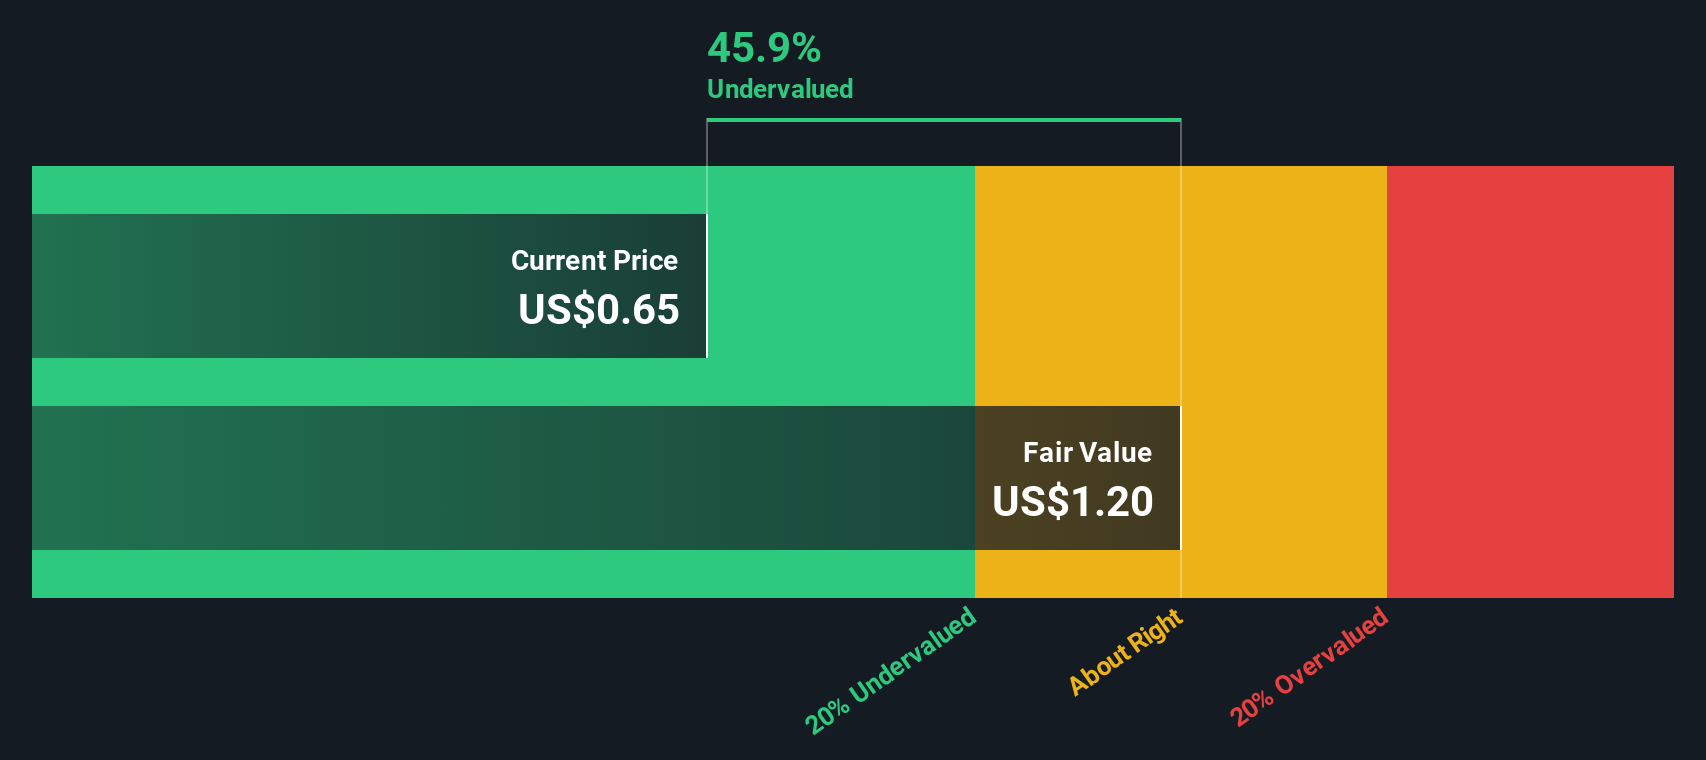
Putting all of those projected cash flows into the 2 Stage Free Cash Flow to Equity model gives an estimated intrinsic value of US$9.65 per share. Compared with the recent share price of US$7.51, the DCF output implies the stock screens as about 22.2% undervalued on this method.
Result: UNDERVALUED
Our Discounted Cash Flow (DCF) analysis suggests Tilray Brands is undervalued by 22.2%. Track this in your watchlist or portfolio, or discover 55 more high quality undervalued stocks.
Approach 2: Tilray Brands Price vs Sales
For companies where earnings are limited or volatile, the P/S ratio is often a more useful yardstick because it compares the share price to the revenue base rather than profits that may be small or negative.
What counts as a reasonable P/S ratio usually reflects how quickly investors expect revenue to grow and how much risk they see in those cash flows. Higher growth and lower perceived risk can justify a higher multiple, while lower growth or higher risk typically points to a lower multiple being appropriate.
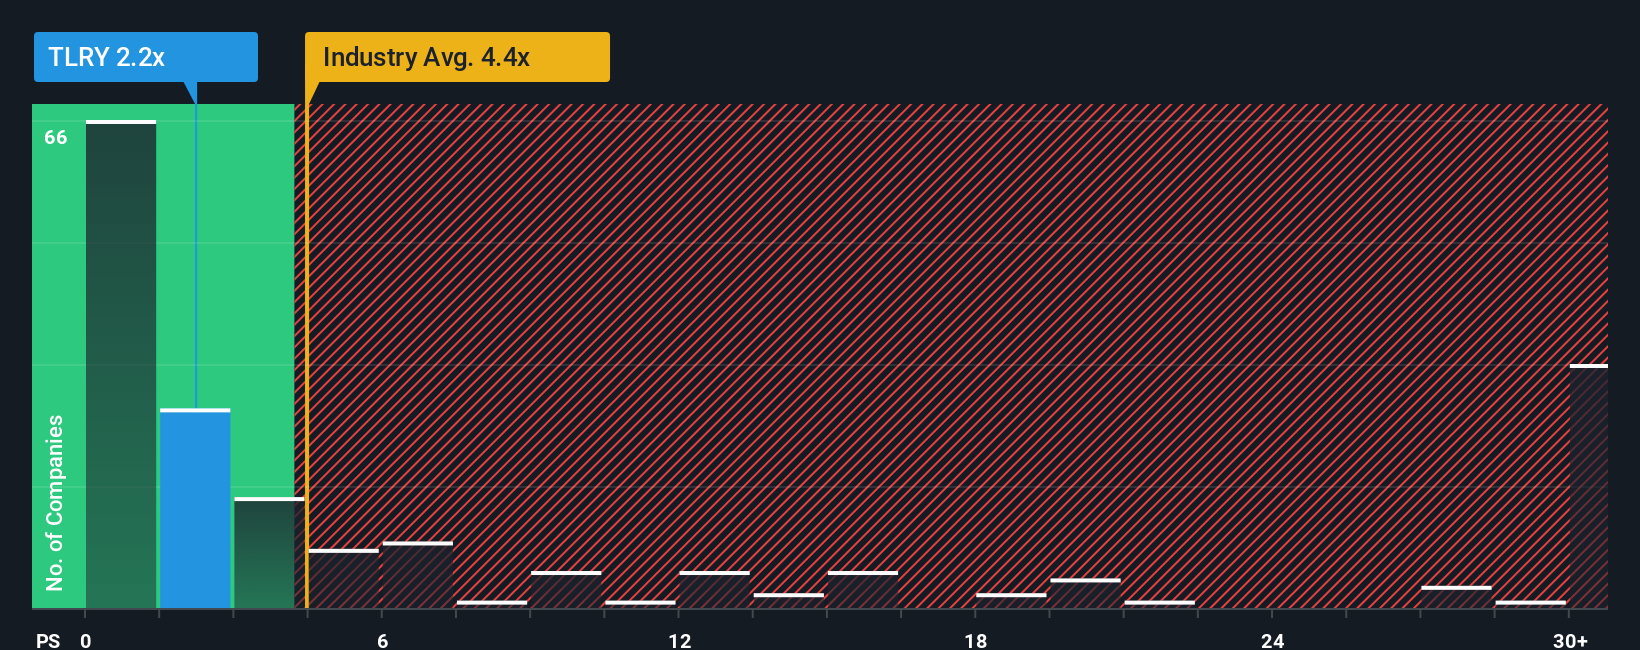
Tilray Brands currently trades on a P/S ratio of 1.04x. That is well below the Pharmaceuticals industry average P/S of 4.30x and also below the peer average of 10.18x. Simply Wall St’s Fair Ratio for Tilray Brands is 1.81x, which is the P/S level suggested by its specific mix of earnings profile, industry, margins, market cap and risk factors.
The Fair Ratio is more tailored than a straight comparison with peers or the sector because it attempts to adjust for company specific growth, profitability and risk, rather than assuming all operators in the same industry deserve similar pricing.
On this basis, Tilray Brands P/S of 1.04x is below the Fair Ratio of 1.81x, which indicates that the shares screen as undervalued on this measure.
Result: UNDERVALUED
P/S ratios tell one story, but what if the real opportunity lies elsewhere? Start investing in legacies, not executives. Discover our 23 top founder-led companies.
Upgrade Your Decision Making: Choose your Tilray Brands Narrative
Earlier we mentioned that there is an even better way to understand valuation, so let us introduce you to Narratives. These are simply your story about Tilray Brands tied directly to your assumptions for future revenue, earnings and margins. They are then translated into a Fair Value that you can compare with the current price on Simply Wall St's Community page, where millions of investors share their views. For Tilray Brands, one investor might build a cautious Narrative around the lower US$0.60 Fair Value with modest revenue growth and a low future P/E, while another builds an optimistic Narrative around a higher US$16.17 Fair Value with stronger growth and a higher multiple. As news, earnings or guidance arrive, those Narratives update automatically so you can quickly see whether your Fair Value still supports holding, adding or trimming your position.
For Tilray Brands, however, we will make it really easy for you with previews of two leading Tilray Brands Narratives:
These are not buy or sell calls. They are two structured ways to think about the same stock using different assumptions so you can see which feels closer to your own view.
Fair Value: US$9.25 per share
Implied discount to this Fair Value versus the last close of US$7.51: about 18.8% undervalued based on ((9.25 - 7.51) / 9.25)
Assumed revenue growth: 2.91% per year
- Analysts in this camp are comfortable using a Fair Value of US$9.25, with modest revenue growth and a profit margin assumption of about 20.9% paired with a future P/E of about 8.3x.
- They factor in trimmed but still constructive analyst targets, steady discount rate assumptions and slightly higher modeled revenue growth compared with earlier inputs.
- Regulation, capital raises and international expansion are all part of the story, but this narrative still treats current pricing as below the value implied by those long term earnings and margin assumptions.
Fair Value: US$1.83 per share
Implied premium to this Fair Value versus the last close of US$7.51: about 310% overvalued based on ((7.51 - 1.83) / 1.83)
Assumed revenue growth: 5.30% per year
- This narrative aligns with the more optimistic analyst cohort around earnings power, using a Fair Value of about US$1.83 even with revenue growth of about 5.3% a year and profit margins converging toward the CA Pharmaceuticals industry average.
- It leans on a future P/E of about 13.4x and assumes earnings could reach about US$222.7m, but still treats the analyst price target as only modestly above a prior share price of US$1.14.
- The key tension here is that even with higher growth and margin assumptions, dilution risk, cash flow pressure, acquisition integration issues and regulatory uncertainty keep the Fair Value well below the current share price.
Taken together, these Narratives show how different combinations of growth, margins, dilution and required return can produce very different Fair Values from the same set of facts. This is why it helps to decide which set of assumptions you are most comfortable with before you act.
Curious how numbers become stories that shape markets? Explore Community Narratives
Do you think there's more to the story for Tilray Brands? Head over to our Community to see what others are saying!

This article by Simply Wall St is general in nature. We provide commentary based on historical data and analyst forecasts only using an unbiased methodology and our articles are not intended to be financial advice. It does not constitute a recommendation to buy or sell any stock, and does not take account of your objectives, or your financial situation. We aim to bring you long-term focused analysis driven by fundamental data. Note that our analysis may not factor in the latest price-sensitive company announcements or qualitative material. Simply Wall St has no position in any stocks mentioned.
Have feedback on this article? Concerned about the content? Get in touch with us directly. Alternatively, email editorial-team@simplywallst.com