
- LIVE QUOTES
- LEARN
- HELP
 Nasdaq
 Wall Street Journal
EN
Is It Time To Reassess SPS Commerce (SPSC) After A 1 Year Share Price Slump
- If you are wondering whether SPS Commerce is now priced attractively or still expensive after a tough run, this article walks through the numbers in plain English so you can judge the value for yourself.
- The stock last closed at US$61.92, with returns of 17.3% decline over 7 days, 31.3% decline over 30 days, 29.6% decline year to date, 57.6% decline over 1 year, 58.8% decline over 3 years, and 41.8% decline over 5 years.
- These moves have kept SPS Commerce on the radar for investors who watch how sentiment can shift when a share price retraces over multiple timeframes. In this context, many readers are asking whether the current price fairly reflects the business or if sentiment has swung too far.
- Despite this share price record, SPS Commerce currently scores a 5 out of 6 on our valuation checks. This suggests the stock screens as undervalued on most of the methods we use. Next, we will walk through those approaches and hint at an even richer way to think about value at the end of the article.
Find out why SPS Commerce's -57.6% return over the last year is lagging behind its peers.
Approach 1: SPS Commerce Discounted Cash Flow (DCF) Analysis
A Discounted Cash Flow, or DCF, model estimates what a business could be worth today by projecting its future cash flows and discounting them back to the present.
For SPS Commerce, the model uses last twelve months Free Cash Flow of about $152.9 million as a starting point and applies a 2 Stage Free Cash Flow to Equity approach. Analysts provide explicit forecasts up to 2028, including projected Free Cash Flow of $231.0 million in that year, and Simply Wall St extrapolates further Free Cash Flow projections out to 2035 based on those inputs.
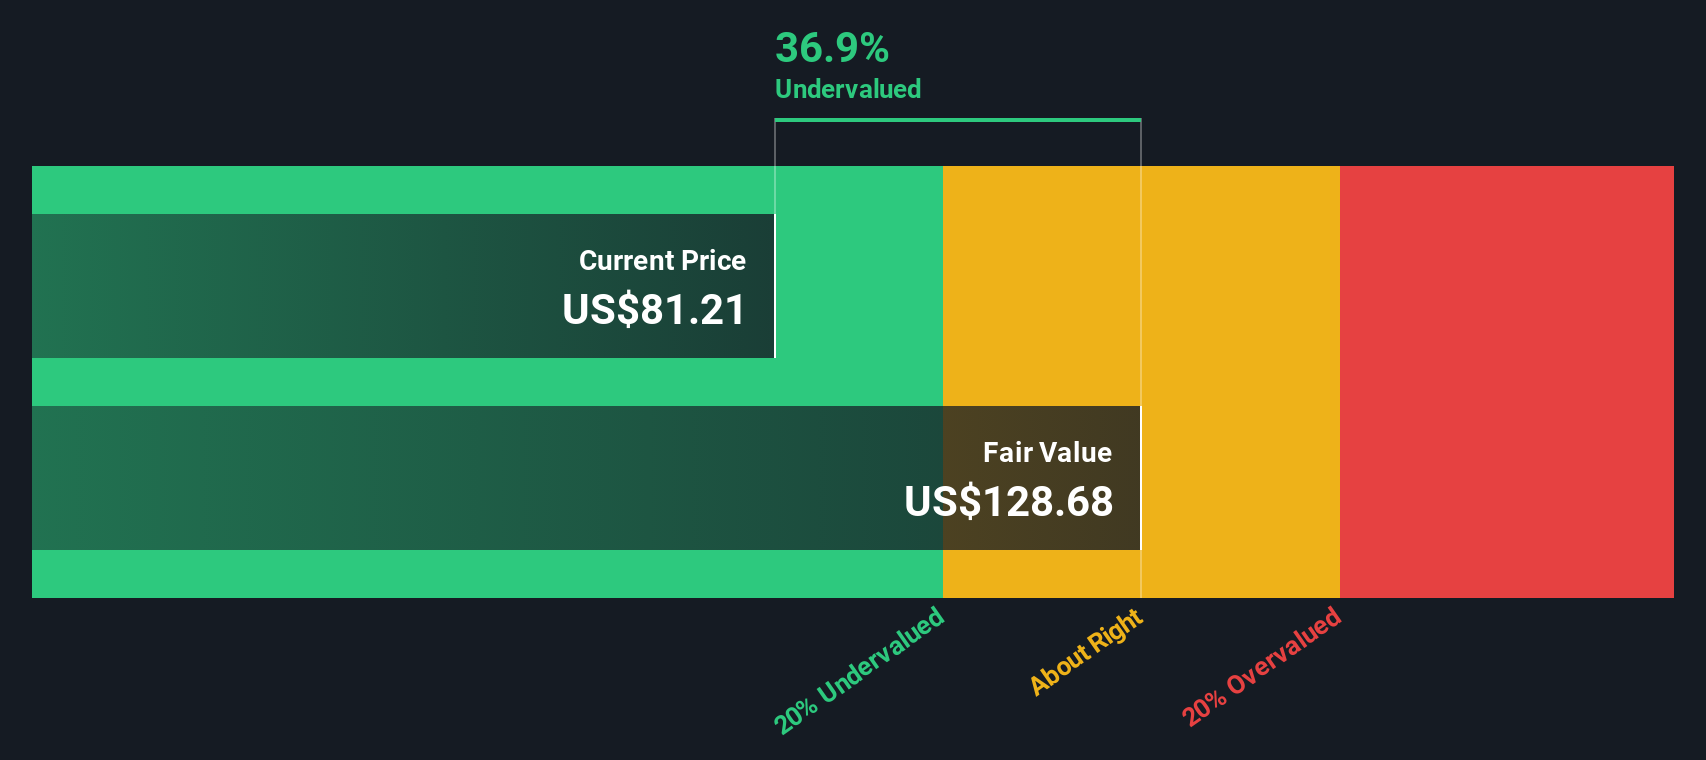
When all those projected cash flows are summed and discounted, the model arrives at an estimated intrinsic value of about US$129.45 per share. Compared with the recent share price of US$61.92, the DCF output implies SPS Commerce trades at roughly a 52.2% discount to this estimate, which indicates that the shares screen as undervalued on this approach.
Result: UNDERVALUED
Our Discounted Cash Flow (DCF) analysis suggests SPS Commerce is undervalued by 52.2%. Track this in your watchlist or portfolio, or discover 55 more high quality undervalued stocks.
Approach 2: SPS Commerce Price vs Earnings
For a profitable company like SPS Commerce, the P/E ratio is a useful shortcut because it links what you pay for each share to the earnings that business is currently generating. Investors usually accept a higher P/E when they expect stronger growth or see lower risk, and look for a lower P/E when growth expectations are more modest or risks feel higher.
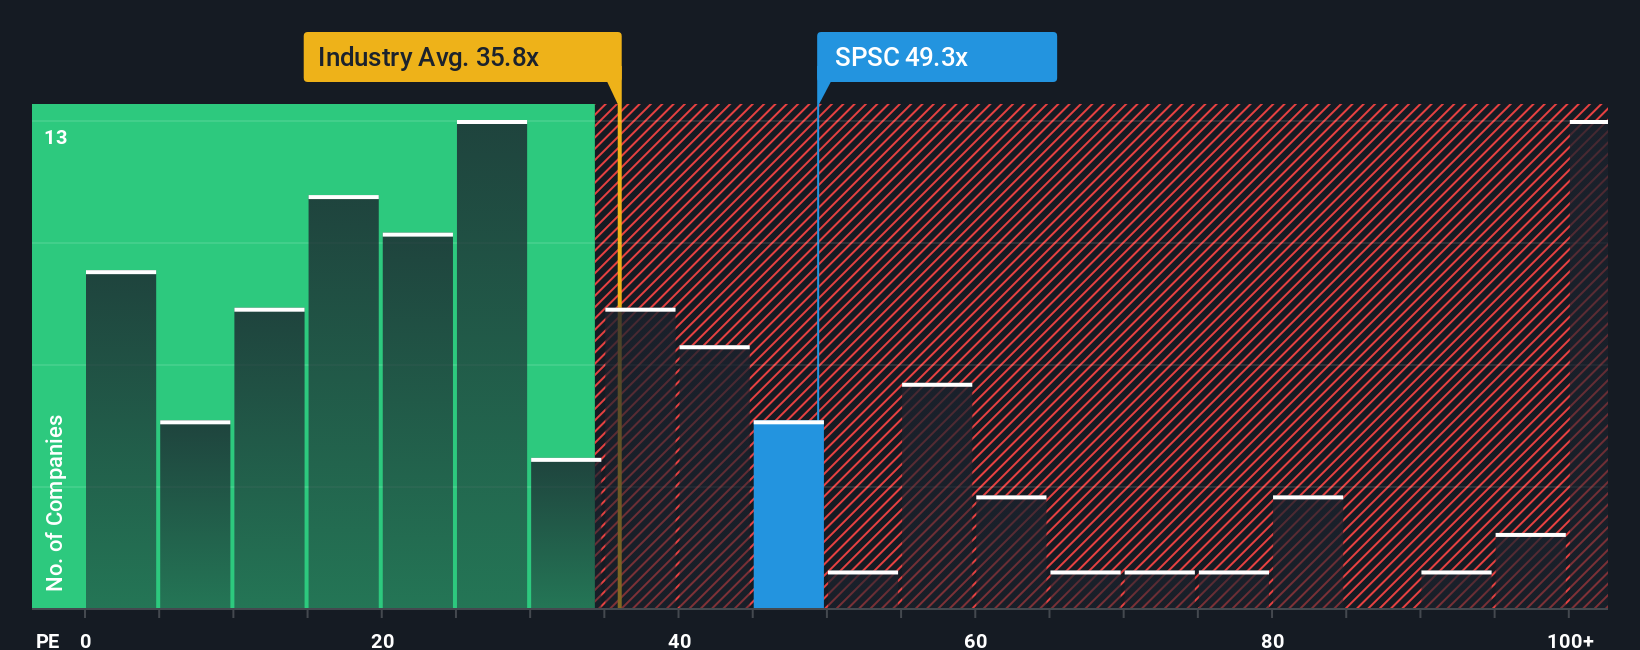
SPS Commerce currently trades on a P/E of 25.0x. That is close to the broader Software industry average of 26.4x, and well below the peer group average of 79.5x, which shows how wide the range of valuations can be across similar companies. To tighten that view, Simply Wall St uses a proprietary “Fair Ratio” of 27.4x, which is the P/E it estimates could be appropriate for SPS Commerce after weighing factors such as earnings growth, industry, profit margin, market size and company specific risks.
This Fair Ratio is often more helpful than a simple comparison to peers or the industry average because it adjusts for those company specific traits rather than assuming all software names should trade on the same multiple. With SPS Commerce at 25.0x versus a Fair Ratio of 27.4x, the shares screen as slightly undervalued on this metric.
Result: UNDERVALUED
P/E ratios tell one story, but what if the real opportunity lies elsewhere? Start investing in legacies, not executives. Discover our 23 top founder-led companies.
Upgrade Your Decision Making: Choose your SPS Commerce Narrative
Earlier we mentioned that there is an even better way to understand valuation, so let us introduce you to Narratives. These are simple story driven forecasts on Simply Wall St’s Community page where you connect your view of SPS Commerce’s business to specific assumptions for future revenue, earnings, margins and a Fair Value, then compare that Fair Value with today’s share price to assess whether the stock appears attractive or stretched.
A Narrative links three pieces together: the business story you believe, the financial model that flows from that story, and the Fair Value estimate that results from those numbers. The platform updates that picture automatically when fresh news, earnings or guidance arrives so your view does not go stale.
For SPS Commerce, one Narrative on the optimistic end currently points to a Fair Value of US$125.00 per share, while a more cautious view points to US$80.00 per share. This shows how two investors looking at the same company can reasonably land in very different places, and why having your own clearly defined Narrative can help you weigh those ranges and make more informed decisions.
Do you think there's more to the story for SPS Commerce? Head over to our Community to see what others are saying!

This article by Simply Wall St is general in nature. We provide commentary based on historical data and analyst forecasts only using an unbiased methodology and our articles are not intended to be financial advice. It does not constitute a recommendation to buy or sell any stock, and does not take account of your objectives, or your financial situation. We aim to bring you long-term focused analysis driven by fundamental data. Note that our analysis may not factor in the latest price-sensitive company announcements or qualitative material. Simply Wall St has no position in any stocks mentioned.
Have feedback on this article? Concerned about the content? Get in touch with us directly. Alternatively, email editorial-team@simplywallst.com