
- LIVE QUOTES
- LEARN
- HELP
 Nasdaq
 Wall Street Journal
EN
Has BridgeBio Pharma (BBIO) Run Too Far After 112% One Year Share Price Surge?
- If you are wondering whether BridgeBio Pharma's share price still reflects good value or has run too far, it helps to step back and look at what the current valuation is really telling you.
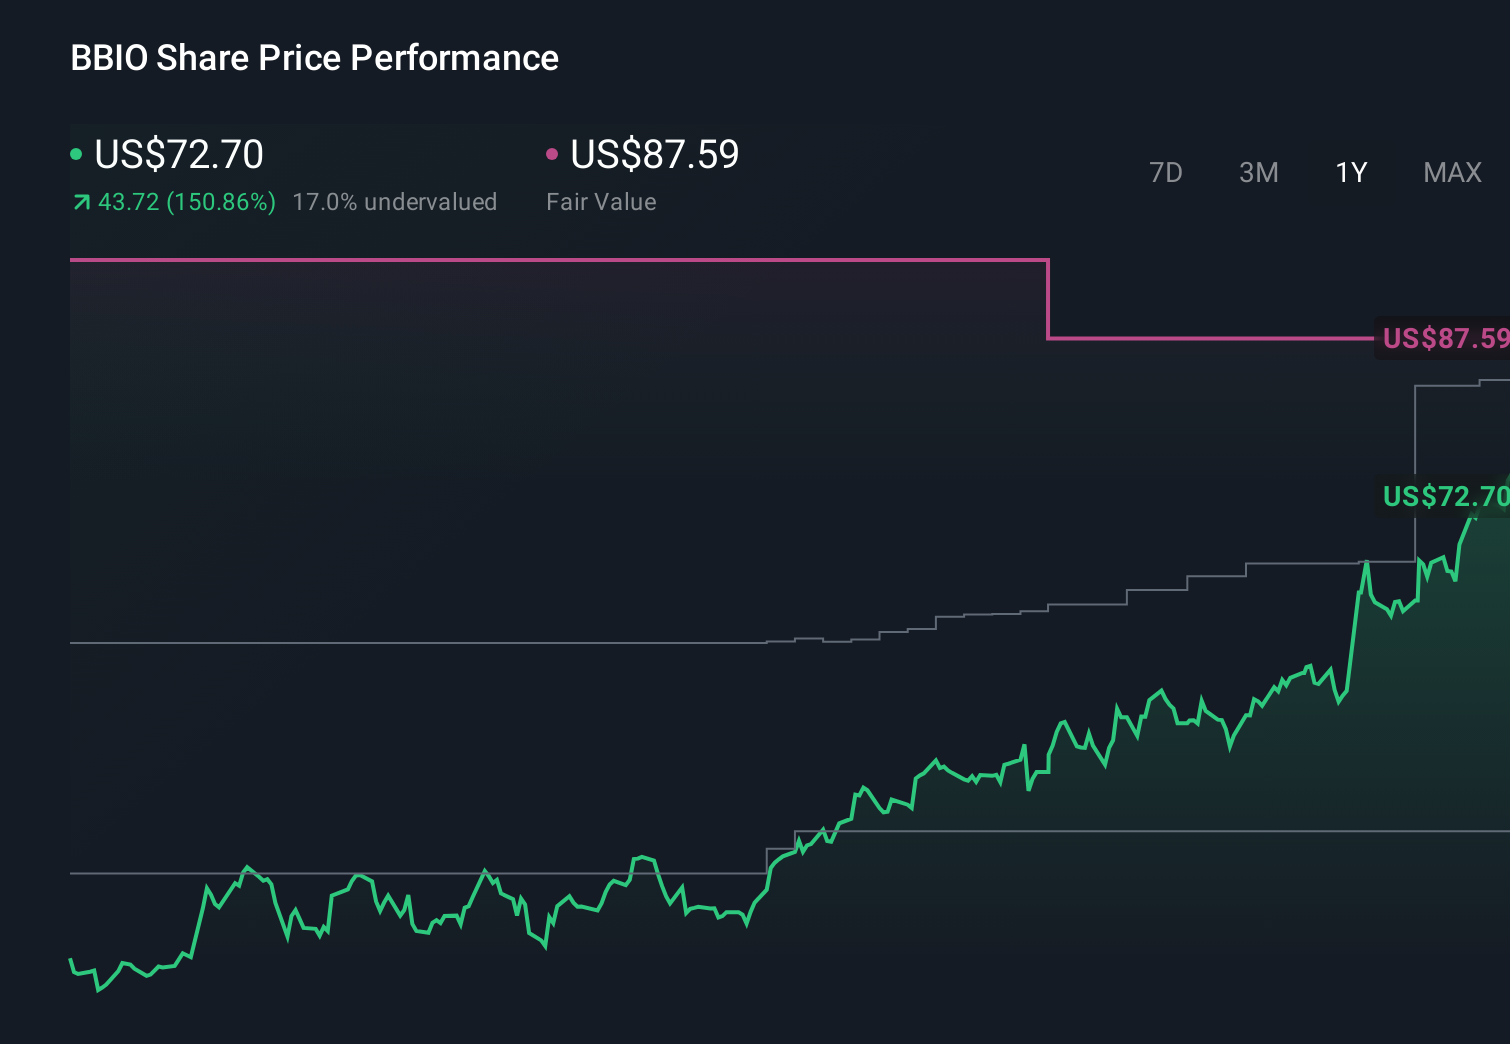
- The stock last closed at US$75.25, with a 3.8% gain over the past week, a 1.3% decline over the past month, a 3.8% decline year to date, and a 112% return over the last year, plus a very large return over three years that is more than 7x.
- These sharp moves have been accompanied by regular clinical and pipeline updates that keep investor attention firmly on BridgeBio's progress, along with ongoing commentary around funding needs and the timing of potential milestones. Together, these news items help frame how much risk and optimism are currently reflected in the share price.
- Simply Wall St's valuation model currently gives BridgeBio Pharma a value score of 2 out of 6. Next, we will look at what different valuation approaches suggest about that score, before finishing with an even more practical way to assess whether the stock fits your portfolio.
BridgeBio Pharma scores just 2/6 on our valuation checks. See what other red flags we found in the full valuation breakdown.
Approach 1: BridgeBio Pharma Discounted Cash Flow (DCF) Analysis
A Discounted Cash Flow, or DCF, model takes estimates of a company’s future cash flows and discounts them back to today to arrive at an intrinsic value per share.
For BridgeBio Pharma, the model used is a 2 Stage Free Cash Flow to Equity approach. The latest twelve month free cash flow is a loss of $597.3 million. Analysts provide specific free cash flow estimates out to 2030, with projected free cash flow of $1.9 billion in that year. Beyond the first five years, Simply Wall St extrapolates the cash flow path using the earlier estimates as a starting point.
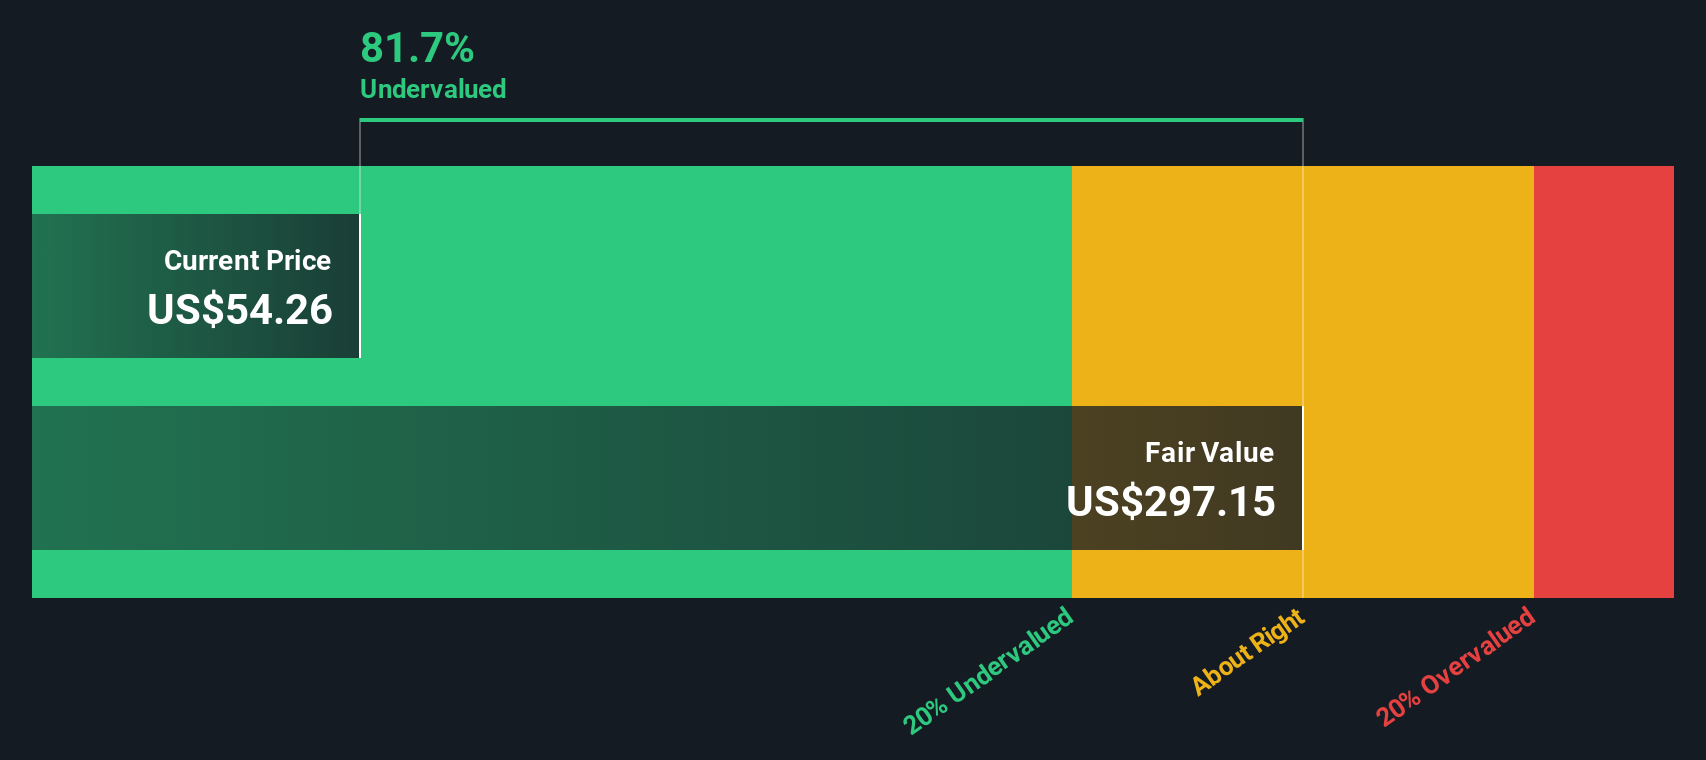
Putting all of those projected cash flows together and discounting them back to today results in an estimated intrinsic value of about $289.49 per share. Compared with the recent share price of $75.25, the DCF output suggests the stock is about 74.0% below that intrinsic value, which points to a wide gap between the market price and this particular model.
Result: UNDERVALUED
Our Discounted Cash Flow (DCF) analysis suggests BridgeBio Pharma is undervalued by 74.0%. Track this in your watchlist or portfolio, or discover 55 more high quality undervalued stocks.
Approach 2: BridgeBio Pharma Price vs Sales
For profitable companies, simple valuation multiples can be a useful cross check on a DCF model because they relate the share price directly to familiar fundamentals like earnings, sales or book value. The level of a "normal" P/E, P/S or P/B ratio tends to reflect what investors expect for future growth and how much risk they see in the business, with higher expected growth or lower perceived risk usually linked to higher multiples.
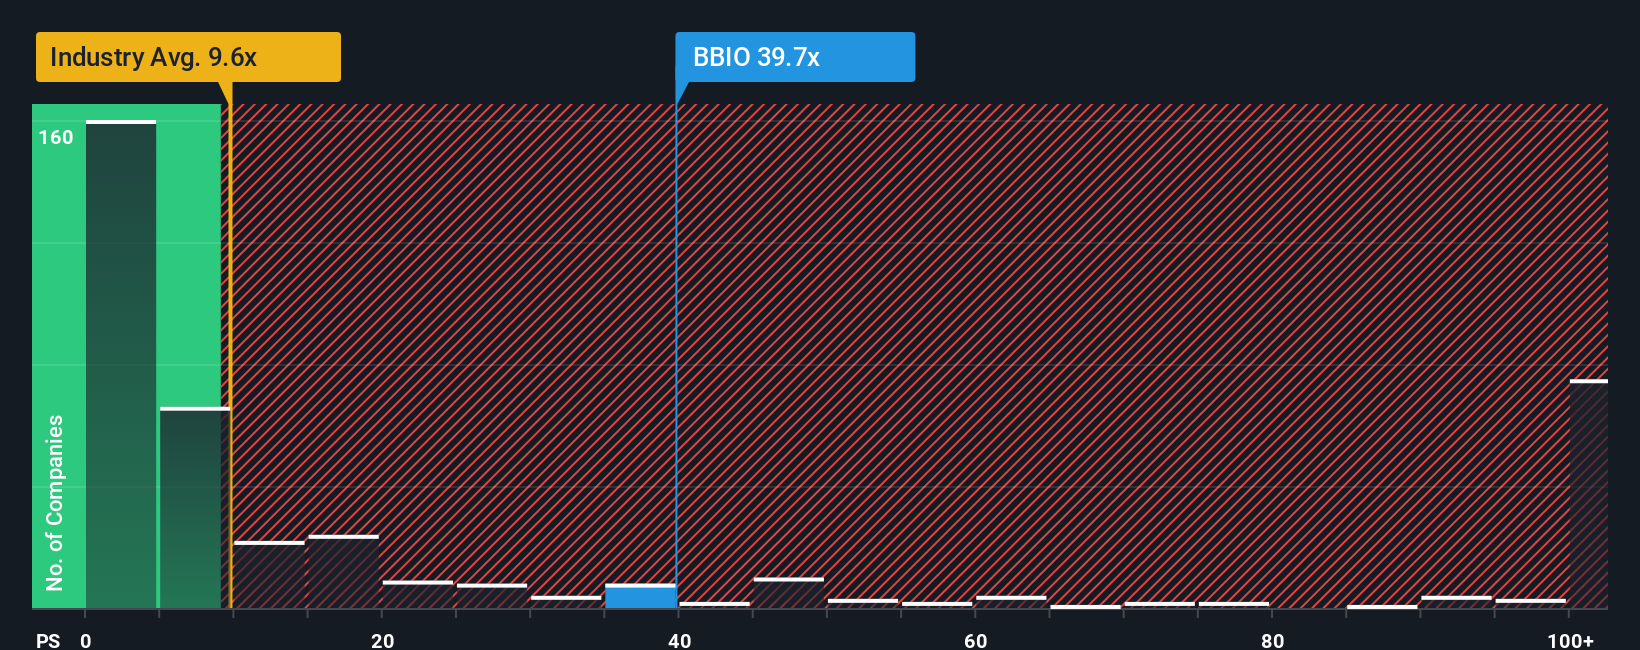
For BridgeBio Pharma, the preferred metric is the P/S ratio. The stock is currently trading on a P/S of 40.99x, compared with the Biotechs industry average of 11.34x and a peer group average of 18.59x. Simply Wall St also calculates a proprietary "Fair Ratio" of 23.80x, which is the P/S level suggested after factoring in elements such as earnings growth estimates, profit margins, industry, market cap and company specific risks.
This Fair Ratio aims to be more tailored than a simple comparison with peers or the broad industry, because it adjusts for BridgeBio Pharma's own profile rather than assuming all companies should trade on the same multiple. With the current P/S of 40.99x sitting well above the Fair Ratio of 23.80x, this approach points to the shares looking overvalued on a sales based metric.
Result: OVERVALUED
P/S ratios tell one story, but what if the real opportunity lies elsewhere? Start investing in legacies, not executives. Discover our 23 top founder-led companies.
Upgrade Your Decision Making: Choose your BridgeBio Pharma Narrative
Earlier we mentioned that there is an even better way to understand valuation. Let us introduce you to Narratives, which are simple stories you create about a company that sit behind the numbers you use for fair value, future revenue, earnings and margins. Narratives link BridgeBio Pharma’s business story to a forecast and then to a fair value you can compare with today’s price on Simply Wall St’s Community page. Narratives are updated automatically when new news or earnings arrive. One investor might build a bullish BridgeBio Pharma Narrative around a higher fair value of about US$127.69 per share based on strong late stage pipeline assumptions. Another might build a more cautious Narrative closer to US$41.00 per share that leans on more conservative revenue growth and profitability expectations. Each investor can then use their own Fair Value versus the current Price to help decide whether the stock looks attractive, fairly priced or expensive for their portfolio.
For BridgeBio Pharma, we will make it straightforward for you by providing previews of two leading BridgeBio Pharma Narratives:
Each one takes the same stock and valuation debate you have just seen and turns it into a clear story about what needs to happen for the current price to make sense. Your job is to decide which story, or combination of stories, feels closest to how you see the company.
Here is how the bullish and bearish Narratives compare side by side using the latest inputs.
Fair value in this bullish Narrative: about US$127.69 per share
Implied discount to this fair value at the last close of US$75.25: about 41.1% undervalued
Annual revenue growth assumption in this Narrative: about 104.18%
- Leans on very strong growth expectations for Attruby and other late stage genetic programs, with several large commercial opportunities modeled into the later years.
- Assumes BridgeBio can support rising revenue with higher profit margins and a richer future P/E multiple, supported by access to capital and partnerships that keep the balance sheet in good shape.
- Accepts meaningful risks around rare disease focus, competition, pricing pressure and clinical trials, but views these as manageable relative to the long term earnings potential in the models.
Fair value in this bearish Narrative: about US$41.00 per share
Implied premium to this fair value at the last close of US$75.25: about 45.3% overvalued
Annual revenue growth assumption in this Narrative: about 66.36%
- Focuses on BridgeBio's reliance on a narrow group of late stage assets, with a large share of the story tied to Attruby and related programs, which concentrates clinical, regulatory and commercial risk.
- Highlights high operating costs and the possibility of future dilution if spending stays high, while also noting policy pressure on orphan drug pricing and reimbursement as a key overhang.
- Builds in healthy revenue growth but still requires a high future P/E multiple to support the bearish analyst price target, which this Narrative treats as difficult to justify if competition, pricing or trial outcomes disappoint.
Looking across these Narratives, the same company supports very different fair values, from about US$41.00 to about US$127.69, with the last close of US$75.25 sitting between those points. Your next step is to decide which set of assumptions about revenue growth, margins, execution risk and future P/E feels more realistic for you, then use that preferred Narrative as your reference point when you look at the current share price.
Curious how numbers become stories that shape markets? Explore Community Narratives
Do you think there's more to the story for BridgeBio Pharma? Head over to our Community to see what others are saying!
This article by Simply Wall St is general in nature. We provide commentary based on historical data and analyst forecasts only using an unbiased methodology and our articles are not intended to be financial advice. It does not constitute a recommendation to buy or sell any stock, and does not take account of your objectives, or your financial situation. We aim to bring you long-term focused analysis driven by fundamental data. Note that our analysis may not factor in the latest price-sensitive company announcements or qualitative material. Simply Wall St has no position in any stocks mentioned.
Have feedback on this article? Concerned about the content? Get in touch with us directly. Alternatively, email editorial-team@simplywallst.com