
- LIVE QUOTES
- LEARN
- HELP


EN
A Look At M/I Homes (MHO) Valuation As Its Latest 10-K Highlights Revenue Pressure And Buybacks
10-K filing puts M/I Homes’ latest pivot in focus
M/I Homes (MHO) has drawn fresh investor attention after its latest 10-K detailed a 2% revenue decline tied to fewer homes delivered and lower average selling prices, along with increased land investment and share repurchases.
See our latest analysis for M/I Homes.
The recent 10-K and insider selling come against a backdrop of strong positive momentum, with a 30 day share price return of 9.06% and a 1 year total shareholder return of 25.44%, building on a very large 3 year total shareholder return of more than 7x.
If this homebuilder’s move has you thinking about where else capital is flowing in housing related themes, it could be a good moment to broaden your search with 23 top founder-led companies.
With M/I Homes trading near its analyst price target after a strong multi year run and fresh buybacks, the key question now is simple: is there still value on the table here, or is the market already pricing in future growth?
Most Popular Narrative: 5% Undervalued
M/I Homes last closed at $149.58, while the most followed narrative pegs fair value closer to $157, putting its recent buybacks and housing exposure under the microscope.
M/I Homes maintains a robust land position with an owned and controlled supply equating to 5–6 years, which, along with disciplined acquisition and inventory management, minimizes financial risk, enables consistent earnings growth, and positions the company to seize market share during future housing upturns.
Operational improvements such as better build cycle times, smart spec strategy, and tight cost controls including leveraging incentives primarily through mortgage rate buydowns are stabilizing gross margins despite current market pressure, setting the foundation for net margin expansion as demand normalizes.
Curious how a higher margin profile, modest revenue growth, and a lower future P/E multiple still add up to that fair value? The narrative leans on specific assumptions about earnings power, buyback driven EPS shifts, and a discount rate just under 10% that you may want to pressure test for yourself.
Result: Fair Value of $157 (UNDERVALUED)
Have a read of the narrative in full and understand what's behind the forecasts.
However, softer new contracts and rising SG&A costs mean weaker demand or slower volume could quickly challenge the margin story that supports the view that the shares are 5% undervalued.
Find out about the key risks to this M/I Homes narrative.
Another View: Cash Flows Paint A Harsher Picture
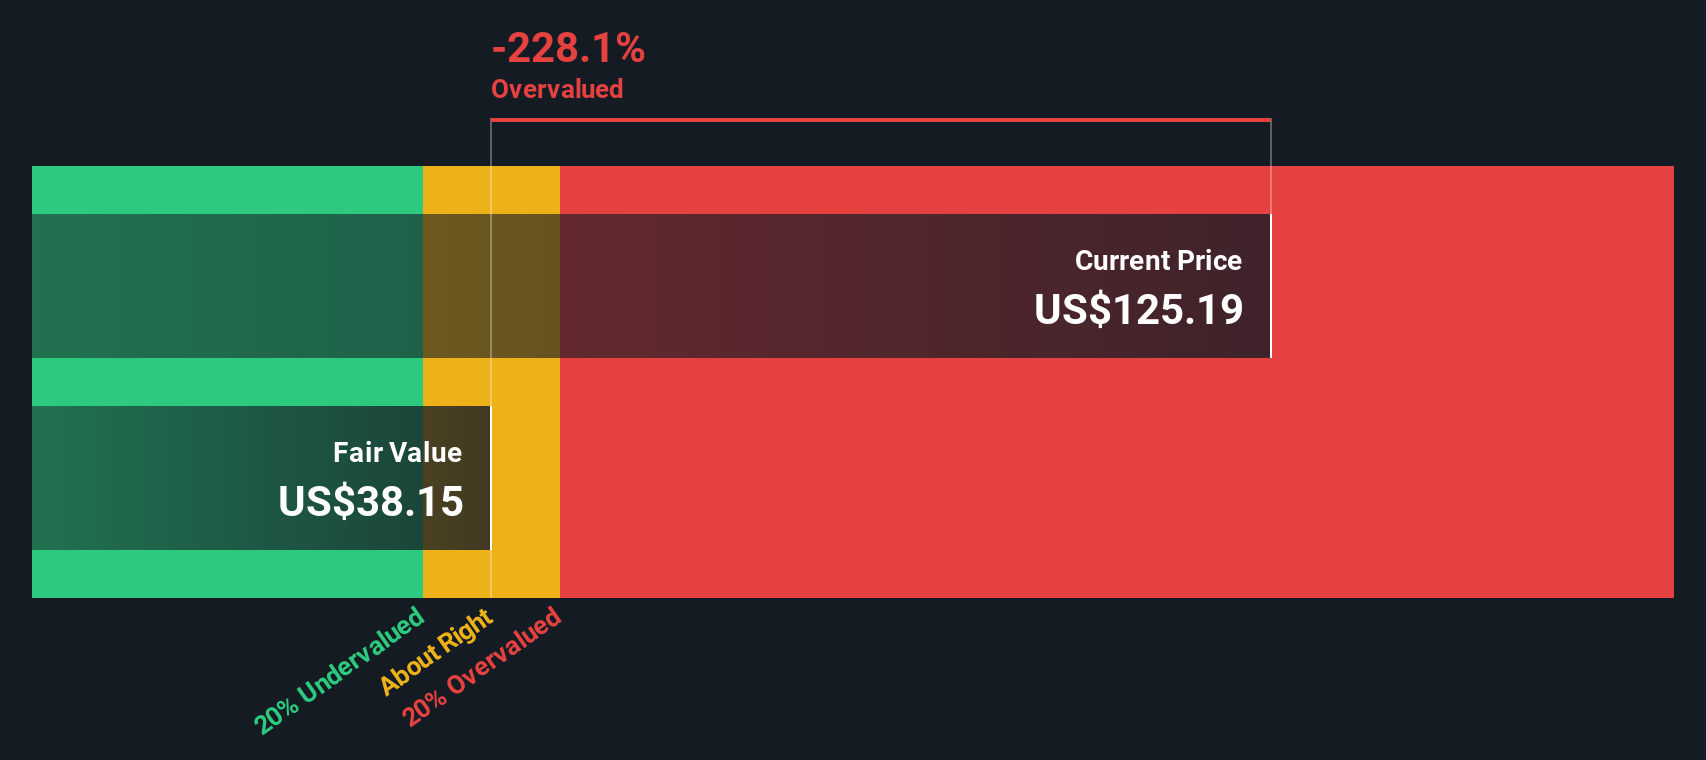
While the popular narrative points to a fair value of $157 and a 5% undervaluation, our DCF model suggests something very different. On that cash flow view, M/I Homes at $149.58 sits well above an estimated future cash flow value of $52.69, which screens as overvalued. So which story do you trust more: earnings power or cash generation?
Look into how the SWS DCF model arrives at its fair value.
Simply Wall St performs a discounted cash flow (DCF) on every stock in the world every day (check out M/I Homes for example). We show the entire calculation in full. You can track the result in your watchlist or portfolio and be alerted when this changes, or use our stock screener to discover 55 high quality undervalued stocks. If you save a screener we even alert you when new companies match - so you never miss a potential opportunity.
Next Steps
With the article pointing to both pressure and promise, this is a good time to look at the numbers yourself and move quickly to shape your own view. You can start with 2 key rewards and 1 important warning sign.
Ready to widen your opportunity set?
If M/I Homes has sharpened your focus, do not stop here. Use the Simply Wall St Screener to quickly surface other ideas that fit your own risk and return preferences.
- Target potential upside with companies that combine quality fundamentals and attractive pricing by scanning our 55 high quality undervalued stocks built from daily valuation checks.
- Strengthen your income stream by reviewing our hand picked list of 13 dividend fortresses that may appeal if reliable payouts matter to you.
- Reduce sleepless nights by checking our 82 resilient stocks with low risk scores that highlight businesses with lower risk scores across balance sheet and earnings metrics.
This article by Simply Wall St is general in nature. We provide commentary based on historical data and analyst forecasts only using an unbiased methodology and our articles are not intended to be financial advice. It does not constitute a recommendation to buy or sell any stock, and does not take account of your objectives, or your financial situation. We aim to bring you long-term focused analysis driven by fundamental data. Note that our analysis may not factor in the latest price-sensitive company announcements or qualitative material. Simply Wall St has no position in any stocks mentioned.
Have feedback on this article? Concerned about the content? Get in touch with us directly. Alternatively, email editorial-team@simplywallst.com