
- LIVE QUOTES
- LEARN
- HELP
 Nasdaq
 Wall Street Journal
EN
Is Rithm Capital (RITM) Offering Value After The Recent Share Price Pullback
- If you are wondering whether Rithm Capital is offering good value at its current price, this breakdown will help you understand what the market might be pricing in and what it could be missing.
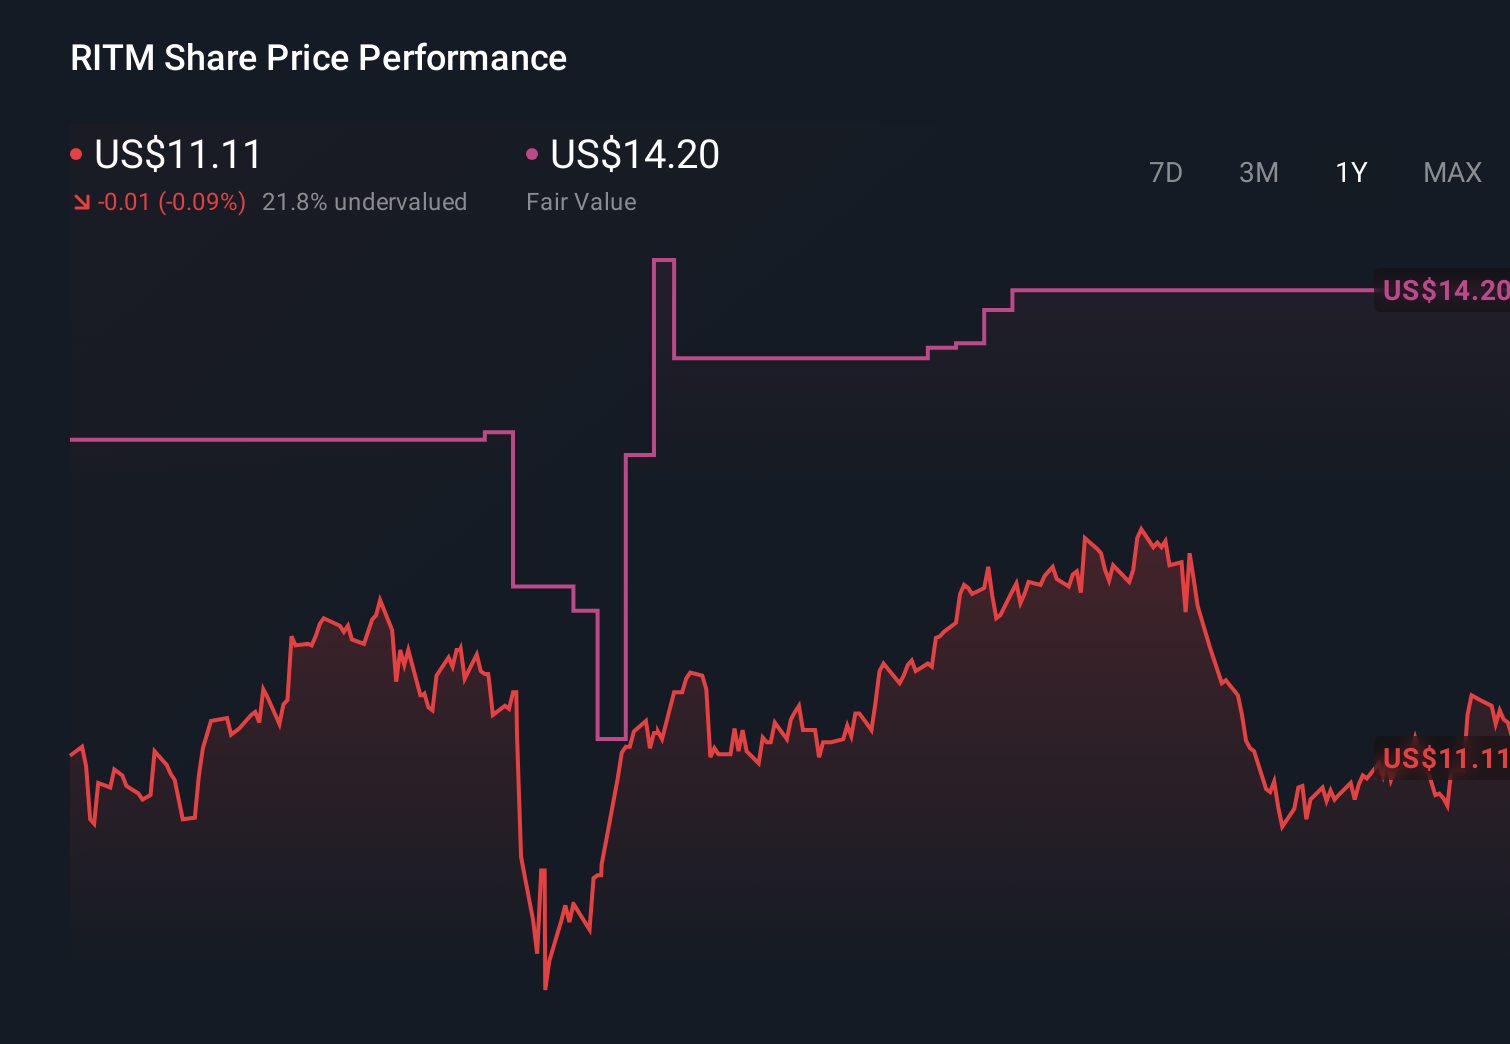
- The stock recently closed at US$10.57, with short term returns showing a 1.5% decline over 7 days and a 10.1% decline over 30 days, while the longer view shows returns of 48.1% over 3 years and 73.6% over 5 years.
- Recent coverage around Rithm Capital has focused on its position within the diversified financials space and how investors are weighing interest rate trends and asset quality when thinking about future performance. This backdrop helps frame the recent pullback, as investors reassess both risk and potential reward.
- On our valuation checks, Rithm Capital currently scores a 6 out of 6. Next, we will walk through the key valuation approaches behind that figure, then finish with a way to view valuation that brings all of these methods together.
Find out why Rithm Capital's -3.9% return over the last year is lagging behind its peers.
Approach 1: Rithm Capital Excess Returns Analysis
The Excess Returns model looks at how much profit a company is expected to earn above the return that equity investors require, then converts that stream of “excess” profits into an intrinsic value per share.
For Rithm Capital, the starting point is its Book Value of US$12.66 per share and a Stable EPS estimate of US$2.51 per share, based on weighted future Return on Equity estimates from 4 analysts. The model applies a Cost of Equity of US$1.33 per share, which implies an Excess Return of US$1.18 per share, and uses an Average Return on Equity of 17.14% to gauge how efficiently that equity base may be used.
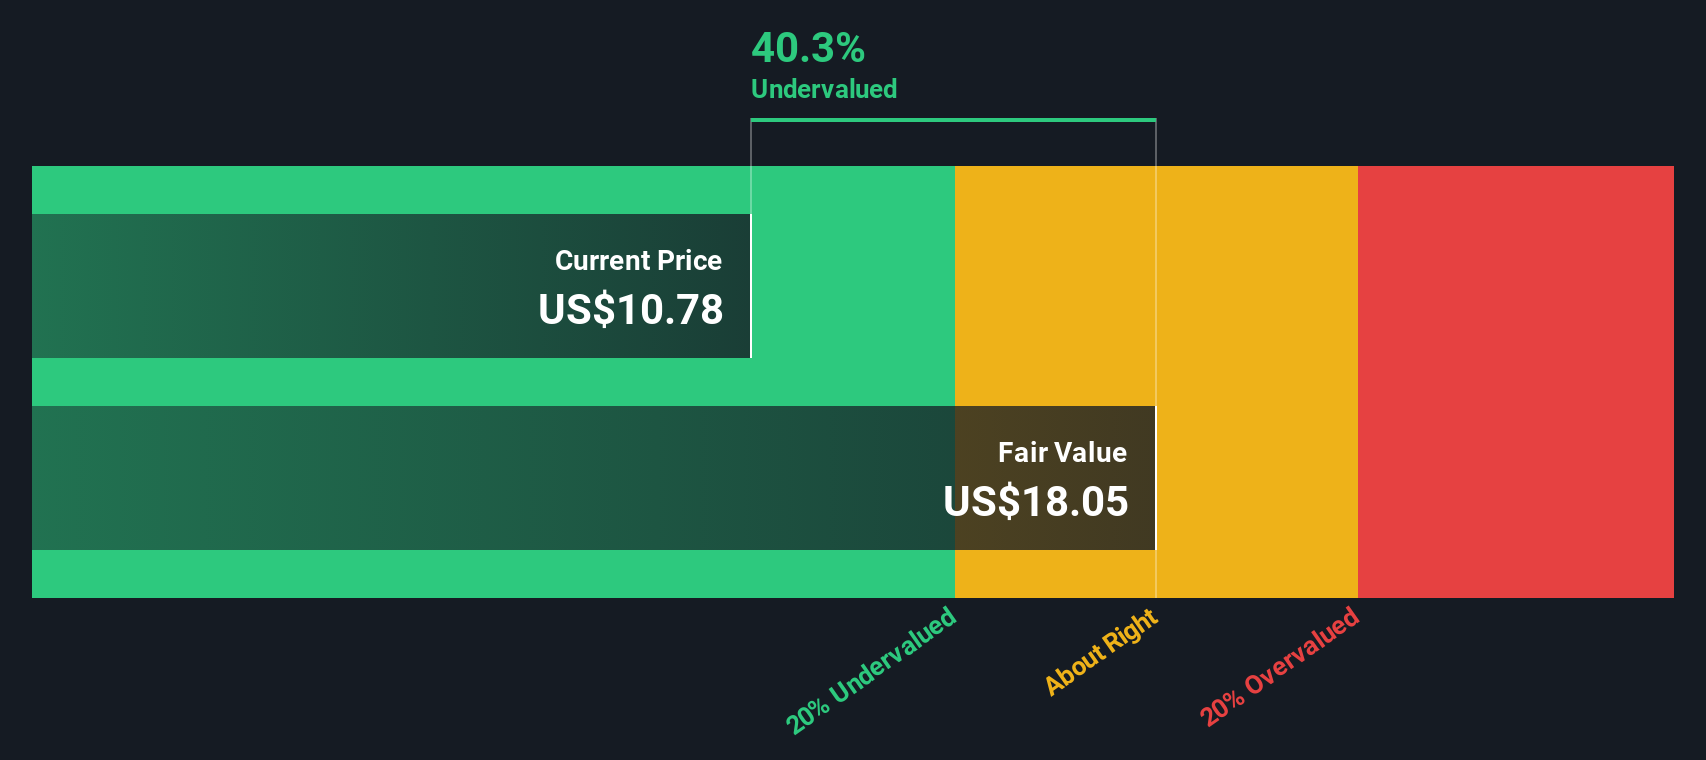
The analysis also references a Stable Book Value of US$14.64 per share, sourced from weighted future Book Value estimates from 3 analysts. Putting these inputs together, the Excess Returns framework produces an estimated intrinsic value of US$35.53 per share. Compared with the recent price of US$10.57, this suggests the stock is 70.3% undervalued on this model.
Result: UNDERVALUED
Our Excess Returns analysis suggests Rithm Capital is undervalued by 70.3%. Track this in your watchlist or portfolio, or discover 53 more high quality undervalued stocks.
Approach 2: Rithm Capital Price vs Earnings
P/E is a useful yardstick for profitable companies because it links what you are paying directly to the earnings the business is already generating. It gives you a quick sense of how many dollars investors are willing to pay today for one dollar of current earnings.
What counts as a “normal” P/E depends a lot on how the market views a company’s growth outlook and risk profile. Higher growth or lower perceived risk often comes with a higher P/E, while slower growth or higher risk usually lines up with a lower P/E.
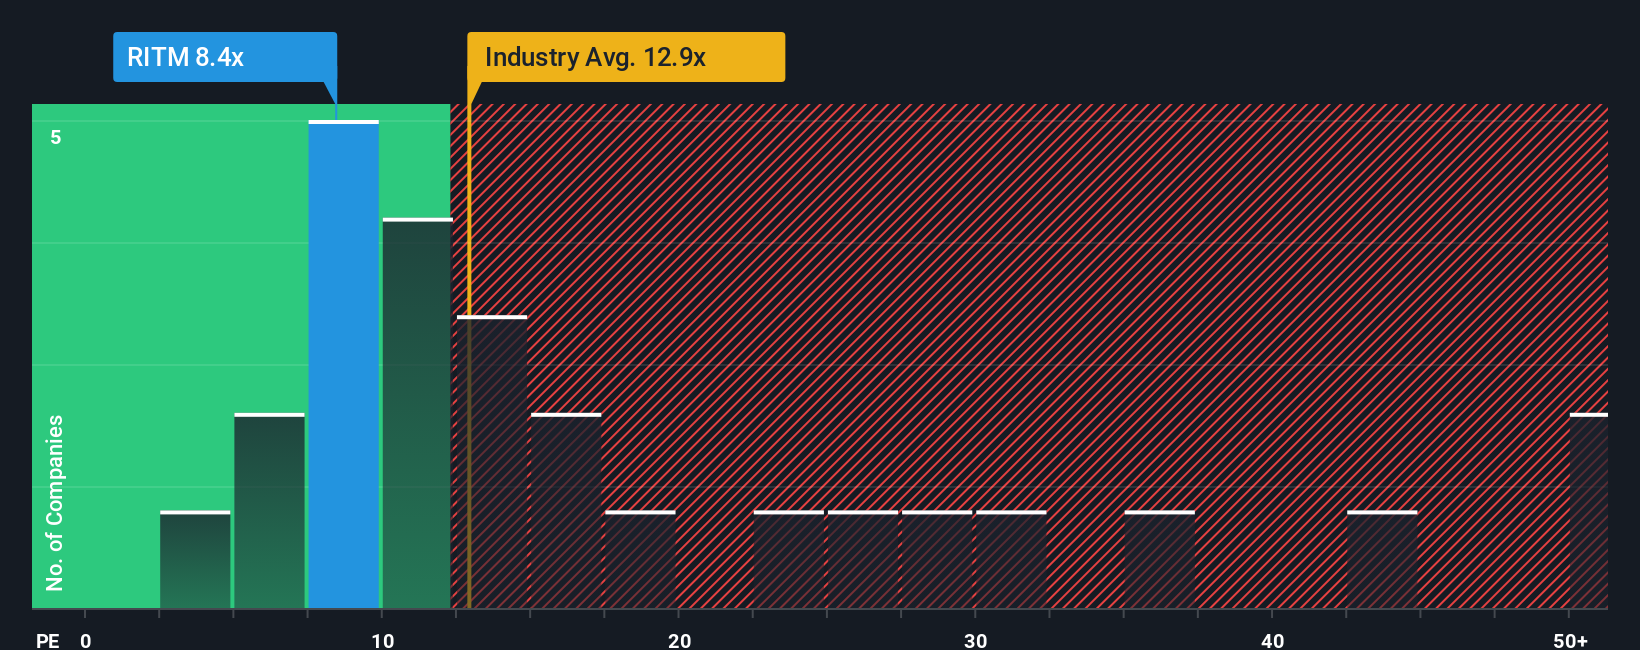
Rithm Capital currently trades on a P/E of 10.36x, compared with the Mortgage REITs industry average of 12.45x and a broader peer average of 18.08x. Simply Wall St’s Fair Ratio for Rithm Capital is 15.92x. This Fair Ratio is a proprietary view of what the P/E might be given factors such as the company’s earnings growth, industry, profit margin, market cap and risk profile.
The Fair Ratio can often be more informative than a simple industry or peer comparison because it brings those company specific inputs together, rather than treating all Mortgage REITs or financial stocks as if they deserve the same multiple. On this basis, Rithm Capital’s actual P/E of 10.36x sits below the Fair Ratio of 15.92x, which indicates that the shares appear undervalued on this metric.
Result: UNDERVALUED
P/E ratios tell one story, but what if the real opportunity lies elsewhere? Start investing in legacies, not executives. Discover our 23 top founder-led companies.
Upgrade Your Decision Making: Choose your Rithm Capital Narrative
Earlier we mentioned that there is an even better way to understand valuation. On Simply Wall St’s Community page you can use Narratives, where you set out your story for Rithm Capital, link that story to specific assumptions for future revenue, earnings and margins, and see how those assumptions flow through to a Fair Value that you can compare with the current price. This Fair Value will update automatically when new news or earnings arrive. You can also contrast your view with other investors who might, for example, see Rithm as worth closer to US$16.00 based on optimism around the Paramount acquisition, while others anchor nearer to US$12.50 because they focus more on integration risks and margin pressures.
Do you think there's more to the story for Rithm Capital? Head over to our Community to see what others are saying!
This article by Simply Wall St is general in nature. We provide commentary based on historical data and analyst forecasts only using an unbiased methodology and our articles are not intended to be financial advice. It does not constitute a recommendation to buy or sell any stock, and does not take account of your objectives, or your financial situation. We aim to bring you long-term focused analysis driven by fundamental data. Note that our analysis may not factor in the latest price-sensitive company announcements or qualitative material. Simply Wall St has no position in any stocks mentioned.
Have feedback on this article? Concerned about the content? Get in touch with us directly. Alternatively, email editorial-team@simplywallst.com